Category: ACE Research

  • Local Governance Project: Wellesley

    Local Governance Project: Wellesley

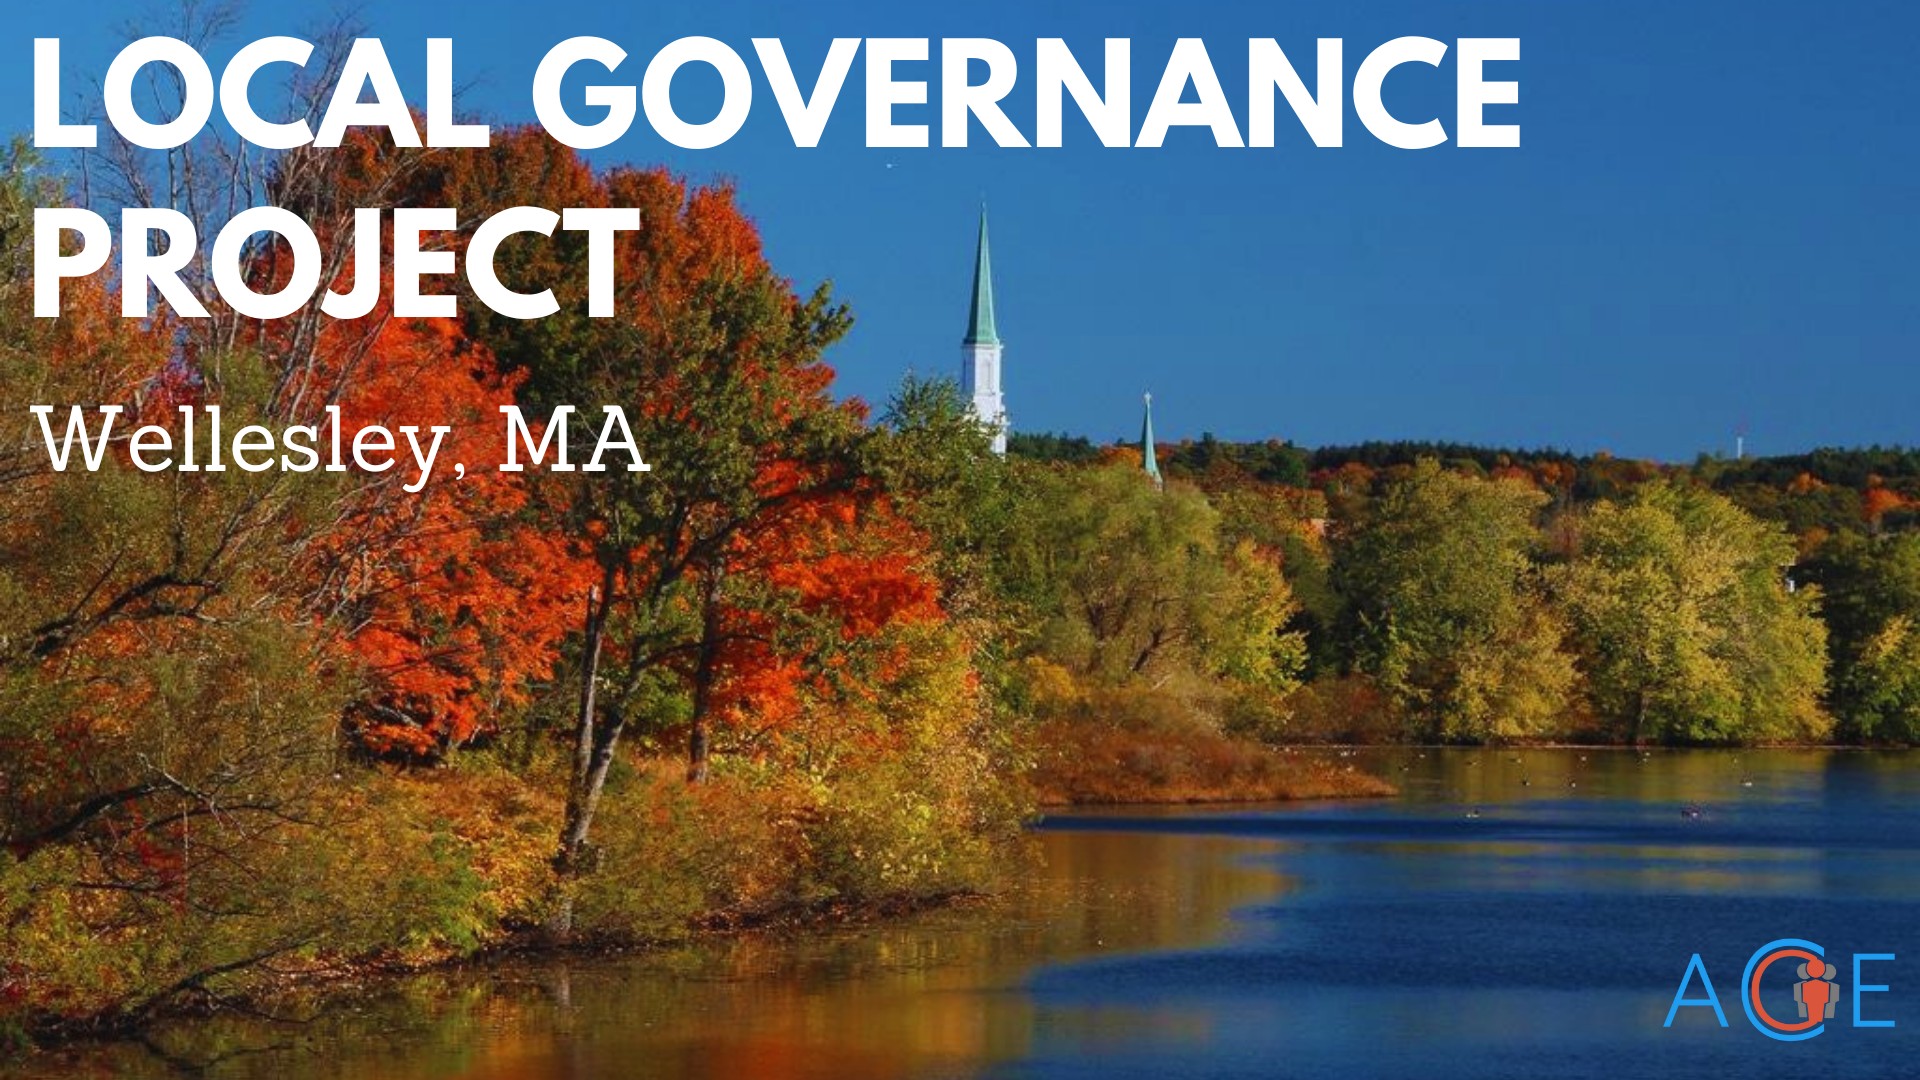
    Introduction to the Local Governance Project

    The Local Governance Project speaks to one of the most important goals of ACE’s most important goals, engaging citizens in the democratic process. The main goal of the Local Governance Project is to identify the political priorities of a specific community and to use these findings to research and present potential policy solutions. To achieve this goal, the project is broken up into three sections. First, a community need must be identified. To complete this step, the Political Priorities Worksheet must be disseminated throughout the community in which the project will be taking place. The Political Priorities Worksheet allows us to identify the community’s priorities and select one that stands out the most for our focus. In the case of this project in Wellesley, Massachusetts, ‘Environmental Policy’ was by far the most common response when residents were asked what their political priorities were. The next stage of the project takes the results from the Political Priorities Worksheet and uses them to conduct further research on the main priority of the community. In addition to researching and presenting an overview of the issue that the community is focused on, potential local government policy solutions should be determined. The final component of the Local Governance Project is the dissemination of the results. The Local Governance Project allows citizens to become engaged with their local government by thinking through their individual political priorities, then becoming educated on the potential policy solutions for their priorities. 

    The Political Priorities Worksheet

    The Political Priorities Worksheet consists of a series of questions geared at identifying the main priorities of the individual. These main issues are broken up into different groups: threshold, primary, and secondary. 

    1. Threshold: Threshold issues are not the issues where voters want to see immediate policy change, but instead are issues where they want their elected representatives to align with them. These issues could be values-based, rather than having a direct influence on a voter’s day to day life. For example, many voters want to support candidates who believe in man-made climate change, even if environmental policy is not their first priority.
    2. Primary: Primary issues are the handful of issues where a voter wants to see immediate legislative activity. They are the issues which cause voters to protest, write letters, and closely follow policy developments. For example, during the 2020 presidential election, the Coronavirus pandemic and government response became the primary issue for many voters, whether they supported further lockdowns and a hardline approach or the lifting of restrictions on dining and other in-person activities.
    3. Secondary: Secondary issues are also issues where a voter wants to see concrete similar to primary issues in the sense that they are things you would like to engage with and see progress, but they are not as important as the primary issues. Many voters have a series of policy changes they would like to see, but they are not the main issues which drive them to the poles.

    The Political Priorities Worksheet provides a comprehensive insight into the priorities of the individual, and is an effective tool in identifying what topics the Local Governance Project should focus on.

    The Results of the Political Priorities Worksheet in Wellesley

    The results from the Wellesley community provide interesting insight into the priorities of Wellesley residents, especially their primary issues. A large majority of Wellesley residents indicated that their primary issue of interest is Environmental Policy & Energy—this was the most popular response 58% of the time. The next most common response was Immigration, which was responsible for 31% of responses. The third most common response was Human Rights, which was responsible for 24% of responses. The rest of the top responses consisted of Public Health, Racial Equality, Democratic Reforms, and Criminal Justice, although none of these came close to the high number of responses that indicated Environmental Policy & Energy as the primary issue for Wellesley residents. 

    There was also conclusive data for the question of the secondary issues of Wellesley residents. The most common response, chosen 9 times, was Education. Following this, Economic Policy, Human Rights and Public Health were all chosen 5 times each. After that, the only issues with significant support were Democratic Reforms and Housing Policy. These results were  interesting because while Education was not one of the major issues chosen for the primary issue section, it was significantly ahead of any other issue in the secondary issue section. The rest of the results of the secondary issue section were consistent with the primary issue section because Human Rights, Public Health and Democratic reforms all gained significant support in both sections. Overall, it can be summarized that the most popular primary issue for Wellesley residents is Environmental Policy & Energy, and the most common secondary issue for Wellesley residents is Education. 

    Results for the threshold issues were not as clear and conclusive. The most common threshold issue was Human Rights, which was chosen a total of 8 times. Constitutional rights was close behind, chosen a total of 7 times. Not far behind is Criminal Justice, which was chosen a total of 6 times. Following these top 3 threshold issues were Human Rights: Disability Rights, Human Rights: Indigenous Rights, Human Rights: Gender Equality, Human Rights: LGBTQ Equality. Thus, it can be concluded that Wellesley residents feel very strongly about a range of Human Rights issues, as well as constitutional rights and Criminal Justice. What is interesting about these results is that although Environmental Policy & Energy was by far the most common response for Primary Issues, it was not even in the top 15 most common threshold issues. This indicates that while many Wellesley residents want to see lots of change and progress in terms of Environmental Policy & Energy, they would still consider supporting a candidate who has a different perspective from them on this issue.

    Environmental Policy Background

    Due to the high number of Wellesley Residents who indicated that their primary issue is environmental policy, I decided to focus on environmental policy solutions for this paper. Environmental policy is defined as, “any action deliberately taken to manage human activities with a view to prevent, reduce, or mitigate harmful effects on nature and natural resources, and ensuring that man-made changes to the environment do not have harmful effects on humans or the environment.” The scope of the environmental issues that these policies aim to address are broad and could include air quality, water, pollution, waste management, etc. Usually, environmental policy focuses on problems that are caused by human activity and tries to address these problems through a series of policy changes. While governments can be influential in implementing such policies, non-government organizations can also have a huge impact. In the United States, environmental policy began as a non-partisan effort, and its start date is usually defined as the beginning of the Environmental Protection Agency in 1970. After this, a series of environmental policies were implemented, such as the Clean Air Act. The European Union also set up the Environmental Action Programme in 1973. Environmental policy is important because it can help combat the effects of the climate crisis. Further, environmental policy can help protect natural resources, and can even help regulate the economy.

    Environmental Policies of Wellesley Town, Massachusetts, and the United States

    There have been many successful environmental policy solutions implemented nationally, regionally, and locally. For example, Wellesley has established a Climate Action Committee (CAC) as part of its local government. The goal of the CAC is to develop and implement initiatives to reduce greenhouse gas emissions from Wellesley’s municipal, residential, commercial, industrial and institutional sectors. The CAC was established in 2010 in response to the town’s goal to reduce greenhouse gas emissions 10% below 2007 levels by 2013. This goal was achieved and was replaced by a goal to reduce greenhouse gas emissions 25% below 2007 levels by 2020. Following this goal, Wellesley has adopted additional greenhouse gas reduction goals for 2030, 2040 and 2050. They hope to achieve 50% below the 2007 baseline by 2030, 75% below by 2040, and eventually reach net-zero emissions by 2050. So far, the CAC has been successful in achieving its goals. To achieve these goals, CAC has implemented a series of initiatives and policies to address a broad range of issues in the Wellesley community. These initiatives include the Green Collaborative, which aims to bring together environmentally minded organizations four times a year. The Energy Reduction initiative includes programs such as ‘Shave the Peak”, which helps to reduce peak power demands on days with extreme weather conditions by reminding residents to use electricity during off-peak hours. Furthermore, the CAC has initiatives such as ‘Sustainable Mobility Plan”, the Transportation Working Group, and Waste Wise Wellesley. These initiatives and programs are examples of local environmental policy initiatives that have been implemented by the town of Wellesley’s CAC branch of the local government.

    While there is value in the implementation of local policy solutions, the climate crisis knows no borders and often demands a broader scale solution. To effectively combat the effects of climate change, policies must be implemented on a regional, national, and even global scale, as well as through local governments. Massachusetts has implemented several initiatives and policies to combat climate change. These include the MA Decarbonization Roadmap, which aims to identify cost effective and equitable solutions to help Massachusetts achieve net zero emissions by 2050. Massachusetts has also led the Transportation and Climate Initiative (TCI), which is a regional collaboration that has been in place since 2010 and works with many areas of the northeast and mid-Atlantic to “improve transportation, develop the clean energy economy, and reduce emissions from transportation.” TCI is not the only initiative in which Massachusetts worked with other neighboring states. For example, all six New England states released a vision statement in October 2020 outlining their vision for a “clean, affordable, and reliable 21st century regional electric grid”. Further, Massachusetts is part of an even more broad scale coalition, the United States Climate Alliance, which is a “​​bipartisan coalition of 24 governors committed to reducing greenhouse gas emissions consistent with the goals of the Paris Agreement”. Lastly, Massachusetts is part of the Commission on the Future of Transportation, implemented a Comprehensive Energy Plan in 2018, and is a member of the Regional Greenhouse Gas Initiative. Massachusetts has joined a series of regional and even national initiatives to combat climate change, in addition to implementing initiatives in local and state government.

    Lastly, we will discuss some of the national and global environmental policies that have been implemented in recent years. Nationally, environmental policy began with the Clean Air Act of 1970, which was followed by the Clean Cater Act in 1977 and the Comprehensive Environmental Response, Compensation and Liability Act (CERCLA) in 1980. Many laws and regulations were passed in the United States from the 1970s to the 1990s. There was a substantial break in the introduction of new environmental policies until 2013 when President Barack Obama “introduced a new climate change plan that will focus on cutting down carbon pollution, preparing for the impacts of climate change and providing international help”. Following this step, the climate alliance was formed, which was an alliance between 14 states across the United States that aimed at addressing climate change. Although there have been a series of major policy changes over the course of US history, there have not been substantial new laws passed in recent years to address climate change. The most substantial global environmental policy to date occurred at the Paris climate conference in 2015. During this conference, all the participating countries adopted the first ever universal agreement, that was legally binding, to work towards certain climate related goals. This conference was organized by the broader organization United Nations Framework Convention on Climate Change.

    Introduction/Background on Water Pollution Issue

    While the town of Wellesley and the state of Massachusetts have been working to combat some of the impacts of climate change through environmental policy, it is clear through the results of the Political Priorities Worksheet that Wellesley residents want to see more being done in terms of environmental policy. To speak to this desire, I investigated the most pressing needs of the Wellesley community to come to a hypothesis about what may be motivating the high numbers of people to choose environmental policy as their primary issue of priority. While there are many manifestations of climate change that impact the daily lives of Wellesley residents, one of the most pressing and difficult to ignore has been the water usage restrictions put in place by the Wellesley Department of Public Works (DPW) in June of 2021. The DPW issued a declaration that implemented many rules and restrictions for outdoor water usage. These restrictions include alternating outdoor watering schedules for houses and businesses, a watering ban from 9am to 5pm, and a general request to decrease outdoor watering time by about 20%. The DPW stated that these restrictions are necessary because the town is facing a water supply shortage after one of the towns water treatment plants was taken offline in May when testing showed levels of PFAS6 substances that were too high. The plant that was closed is located at Morses Pond, and supplied over 1 million gallons of water each day to the town’s homes and businesses before it was forced to close. Thus, the closing of this plant has caused a serious shortage in the town’s water supply system and the restrictions put in place by the DPW aim to avoid a total outdoor water ban in the future. PFAS6 are human made chemicals that are used to make non-stick, stain resistant and water resistant products. The contamination of the Morses pond water plant by PFAS6 and the resulting water usage restrictions illustrate a situation in which environmental policy can be used to combat the impacts of human activity on the climate.

    Problem Statement

    PFAS6 is a new drinking water standard that tests for six different PFAS compounds. The Morses pond plant was the only plant in Wellesley town that had levels of PFAS6 that were higher than the allowed amount. PFAS are manmade chemicals that are stable and are capable of repelling both water and oil. Different PFAS have different lengths and properties which can alter how toxic these chemicals are, making some forms of PFAS more toxic than others. The most common forms of PFAS are perfluorooctanoic acid (PFOA) and perfluorooctanesulfonic acid (PFOS) which have also been studied the most thoroughly. PFAS do not breakdown easily in the environment and they are water soluble which means that while there are low levels of PFAS in many areas of the environment there can be higher levels in water supplies that are near places that manufacture, dispose of or use PFAS. Other than their use in oil and water resistant products, PFAS are often also used by the military and firefighters, and people can be exposed through water contamination, food, through normal use and through manufacturing. Water contamination of PFAS usually occurs near a facility where PFAS are used or produced or locations where PFAS are used for firefighting.

    There are many risks associated with exposure to PFAS, and human exposure is widespread. The majority of people in the United States and other industrialized nations have measurable amounts of PFAS in their blood. PFAS can accumulate in the body over long periods of exposure and can reach a level in the body that will have adverse health effects. That being said, scientists are still learning about the risks of PFAS in the body. Some of the longer chains of PFAS, such as PFOA and PFOS, which have been phased out of production in the United States since 2013 and 2002, respectively, can lead to developmental effects in infants, decrease chance of pregnancy, increase blood pressure during pregnancy, lower infant birth weights, interfere with hormones, increase cholesterol levels, impact the immune system and increase the risk of cancer. Once one understands the risks associated with PFAS contamination, it is clear why Wellesley town decided to close the water treatment plant that was contaminated. The pollution of this water treatment plant by man-made chemicals has created a situation in which environmental policy must be implemented to combat the impacts of this human activity on the climate.

    Objective

    The purpose of this research paper is to identify the cause of the water shortage in Wellesley and then to inform the public about why this problem is occurring and what the potential solutions could be. Now that the causes and risks of PFAS contamination in the Morses Pond water plant have been explained, potential policy solutions can be explored. The first potential policy solution is the expansion of the current state-wide testing program. This would include expanding free testing access to 100% of private water supplies. The second potential policy solution would be to lower the combined standard to 2ppt for PFOA, PFOS, PFNA and PFHxs and 5ppt for GenX. This would allow a lower level of PFAS contamination than what is currently allowed.

    Policy Options

    Expanding Testing: The first policy option that should be explored – expanding the Massachusetts state testing program to test 100% of private water supplies. Currently, MassDEP (Massachusetts Department of Environmental Protection) is conducting PFAS testing for a limited number of private wells as they are only focusing on the towns where 60% or more of local residents are served by private wells. MassDEP has chosen 84 towns in Massachusetts to focus on, but they are not providing free testing for all of the private wells in these 84 towns, despite the fact that the majority of the residents of these towns use private wells to access water. Instead, MassDEP is choosing only 40 wells to be selected and tested. They will choose these wells based on “geographic distribution throughout the town, proximity to potential sources of PFAS, and available funding.” This decision by MassDEP leaves many private water wells un-tested, and thus leaves residents ignorant to the contaminants in their water supplies. A policy option to fix this problem of PFAS contamination and insufficient testing would be to implement statewide free testing in all private water wells in all towns to ensure that 100% of residents’ water supplies have been tested for PFAS contamination.

    Lowering Ceiling on Contaminants: The second policy option that should be explored is lowering the levels of PFAS that are deemed safe in the state of Massachusetts. Currently, Massachusetts allows a combined standard of 20ppt for 6PFAS while the US EPA allows up to 70ppt for 2PFAS. While Massachusetts has already lowered the acceptable combined standard concentration when compared to the EPA, organizations such as the Natural Resources Defense Council (NRDC) suggest that the standard should be lowered even more to establish a combined standard of 2 ppt for PFOA, PFOS, PFNA, and PFHxS and 5ppt for GenX. This option would provide a more detailed insight into the levels of PFAS in the state’s drinking water and allow us to ensure that the levels of PFAS present are not so high that they are harmful to the human body.

    Analysis of Options

    To pass either policy requires cooperation with the Massachusetts Department of Environmental Protection (MassDEP). MassDEP is responsible for initiating the process to develop a new standard for the maximum contaminant level, and to initiate a new statewide testing program. To begin this process, the MassDEP will announce their intention to develop a new standard or testing process. The MassDEP will then propose the revisions in the Massachusetts Register which begins the formal public comment process. Following this, MassDEP will host a public hearing as well as a public meeting to discuss the proposed regulations. The final step of the process includes a series of revisions and public comments which will continue until a final regulation is made.

    This process includes public commentary and discussion about the proposed changes within the community. Thus, these policies will be more successfully passed if the community is aware of the benefits of the policies and how they will positively impact their lives. Both suggested policies will be effective at lowering the levels of PFAS that Wellesley town, and the surrounding towns in the state of Massachusetts, will be consuming unknowingly through public and private water supplies. It is important to reduce the levels of PFAS contamination in public and private water supplies because there are severe health risks that can come from high levels of PFAS consumption. These health risks will be damaging to the lives of Wellesley community members. Further, these policies will save the community money through the reduction of healthcare costs over time. The health risks associated with PFAS contamination are significant and a major reason why these policies may be popular for the public. Further, there are more logistical and practical reasons why the Wellesley community may benefit from these policy changes. These policies would help to avoid water usage regulations similar to what the Wellesley community is experiencing currently. Through the implementation of more routine and preventative testing, there will be less of a need to close water treatment plants last minute. The closing of plants causes a great deal of strain on the Wellesley communities water supply. Increased testing would help to prevent water usage restrictions, which inconvenience the Wellesley community, and cost money to inform the public about.

    While there are many benefits to the implementation of these policies, there are also some potential reasons why the public would be against these policies. First, the implementation of more routine testing will cost money for the state of Massachusetts and the town of Wellesley, especially to provide free testing to all public and private water supplies. To cover these costs, state and town taxes may change or increase, or funding could be taken from other places to implement these policies. Second, the lowering of the maximum contaminant level would mean that more PFAS contamination would be discovered. While this is a good thing in terms of protecting the health of Wellesley residents, it could also mean more frequent closing of water treatment plants. It is likely that many of the water treatment plants in Wellesley and the broader state of Massachusetts have levels of PFAS that would be too high if the suggested maximum contaminant level was implemented. This could be inconvenient for the public because there would be more frequent closings of plants.

    Policy Recommendation

    In order to address the water pollution issue, the options are to expand state sponsored testing to cover 100% of private water supplies, and a combined standard of 2 ppt for PFOA, PFOS, PFNA, and PFHxS and 5ppt for GenX. These policy changes would support the overall health and safety of the Wellesley community, as well as ensure that the community is informed and aware of the contaminants in the public and private water supply. These policies would ensure that the water supplies in Wellesley town are safely monitored and do not contain levels of PFAS that could be harmful to the Wellesley community. These policies would save money long term by decreasing related health risks, as well as by preventing an unexpected closure of a water treatment plant which would lead to restrictions and disrupt the lives of the Wellesley community. For these reasons, I recommend that these policies be implemented as soon as possible to protect the health and safety of the Wellesley community as well as of the state of Massachusetts overall.

    Conclusion

    The Local Governance Project has allowed me to discover the priorities of the Wellesley community and use the information to research and brainstorm potential policy solutions that would speak to the priorities of Wellesley residents. The results of the Political Priorities Worksheet indicated that Wellesley residents were most passionate about environmental policy and energy as their main political priority. Once this was observed, I was able to focus on one specific environmental issue that could be impacted by the implementation of a new environmental policy. The most pressing environmental issue facing Wellesley residents was determined to be water usage restrictions because of PFAS contamination. From this information I was able to identify, analyze and then recommend two potential policy solutions to solve PFAS contamination. In conclusion, the local governance project provided valuable insight into the Wellesley communities environmental needs and potential policy pathways to improve the lives of Wellesley residents through the implementation of environmental policies.
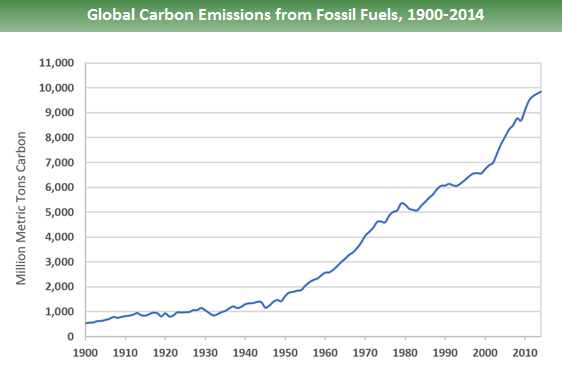
  • Introduction to the American Jobs Plan and Negotiations

    Introduction to the American Jobs Plan and Negotiations

    The American Jobs Plan is the Biden administration’s next major bill after the American Rescue Plan that provided relief during the pandemic. It is described as “the moment to reimagine and rebuild a new economy” on the White House Fact Sheet. The agenda is to create jobs, rebuild infrastructure, and out-compete China. The originally proposed plan had a budget of  roughly 2.2 trillion dollars, including:

    • $621 billion in transportation, 
    • $400 billion in home care services, 
    • $300 in manufacturing, 
    • $180 billion in Research and Development, 
    • $100 billion in workforce development, 
    • $213 billion in housing, 
    • $111 billion in water infrastructure, 
    • $100 billion in schools and child care, 
    • $100 billion in digital infrastructure, and 
    • $18 billion in veteran’s hospitals and federal buildings. 

    Biden proposes that the plan would be funded by a series of tax increases including corporate tax hike from the current 21% to 28% and global minimum tax from 13% to 21%, which in total would raise more than $2 trillion dollars in the next 15 years. For more on how this bill would be paid for, check out the X brief.

    Opposition on Both Sides

    Biden’s first proposal faced strong opposition from the Republican side that viewed the plan as “too big, too expensive, and includes too many tax increases”. One major issue is the definition of infrastructure— Biden’s plan incorporated elderly care and other social spending that the GOP opposes. McCarthy comments that the plan should only include roads, bridges, highways, airports, and broadbands. Another major issue is the tax increase. Senate Minority Leader McConnell has expressed strong views against rolling back of the 2017 tax cuts to pay for the infrastructure package. 

    There is also opposition from the progressive side of the Democratic party. The Congressional Progressive Caucus says that the plan is insufficient to meet the scale of the threat proposed by climate change. Three House Democrats have also vowed to oppose the package because it does not reverse a cap on state and local tax deductions from former president Donald Trump’s tax law. 

    Timeline of Negotiations

    The White House is open for negotiations to reach a bipartisan deal on at least the infrastructure part of the deal and Biden is prepared to carry out the remaining part of the plan without GOP support.

    On May 21, the Biden administration submitted a trimmed-down version of the infrastructure package that costs $1.7 trillion compared to the previous $2 trillion proposal. The details are not open to the public yet, but Reuters reported that it would include reduced funding for broadband, roads, bridges, and other major projects. Jen Psaki, the White House press secretary said that some components, such as investments in research and development, had been removed but would be included in other bills. 

    On May 27th, a group of Senate Republicans proposed a $928 billion counter — still $1 trillion shorter than Biden’s original plan, which outlined a significant increase from the GOP’s first, five-year $568 billion proposal. The new GOP version would direct $755 billion toward traditional infrastructure—$506 billion for roads and bridges, $144 billion for public transit and rail, $56 billion for airports, $22 billion for ports and waterways, and the rest on other miscellaneous transportation-related issues. Republicans allocated $4 billion towards electric vehicle infrastructure ($170 billion less than Biden’s proposed budget on EVs). In addition, the GOP assigned $94 billion to water infrastructure like lead pipe replacement, $65 billion on broadband internet access, and $14 billion on resilience like natural disaster preparedness for at-risk communities. 

    However, only $257 billion of the GOP offer is above baseline levels, which means if projected federal spending of current programs continued, only $257 of the Republican proposal would be financed through additional federal spending. Biden’s $1.7 trillion plan is entirely above current baseline levels, which is why a corporate tax increase from 21% to 28% is needed in Biden’s version. The Senate Republicans, on the other hand, suggested moving “leftover” money from the COVID-19 relief funds to finance the infrastructure plan instead of any tax increase, which Democrats strongly opposed. Much of the relief money that hasn’t been spent will be spent in the coming years on Medicaid, federal lending programs, and state and local relief programs to heal the economy and communities that were hit by the pandemic. 

    On June 24th, Biden reached an agreement with a group of bipartisan Senators on a $1.2 trillion Bipartisan Infrastructure Framework. The Plan would be the largest federal investment in public transit in history, the largest federal investment in passenger rail since the creation of Amtrak, and the single largest dedicated bridge investment since the construction of the interstate highway system. There are also strong focuses on EV infrastructure, renewable energy, water infrastructure, internet access, and resilience against climate change, cyber attacks, and natural disasters. The White House published the below framework for the Bipartisan Infrastructure Framework:

    Amount (billions)
    Total$579
    Transportation$312
    Roads, bridges, major projects$109
    Safety$11
    Public transit$49
    Passenger and Freight Rail$66
    EV infrastructure$7.5
    Electric buses / transit$7.5
    Reconnecting communities$1
    Airports$25
    Ports & Waterways$16
    Infrastructure Financing$20
    Other Infrastructure$266
    Water infrastructure$55
    Broadband infrastructure$65
    Environmental remediation$21
    Power infrastructure incl. Grid authority$73
    Western Water Storage$5
    Resilience$47

    The White House also published the proposed financing sources to fund the infrastructure plan, including reducing IRS tax gap, redirecting unused unemployment insurance relief funds, repurposing unused COVID-10 relief funds, and state and local investment among other sources. 

    Future Developments

    On June 26, Biden issued a statement following the bipartisan agreement that the removed categories in his original infrastructure plan—investments in education, health care, child care, senior housing, clean energy, and tax cuts for families—will be regrouped in his new American Families Plan. He will seek to pass the Families Plan through the process known as reconciliation even without the support of Republicans in Congress. Upon the announcement of the Bipartisan Infrastructure Framework, Biden indicated that he would refuse to sign the infrastructure bill it was sent to him without the Families Plan and other priorities including clean energy. 

    On June 28th, Biden walked away from his threat to veto the infrastructure plan if it was presented to him without the American Families Plan and assuaged some Republicans by clarifying that he would sign the bill if it were passed on its own. Speaker of the House Pelosi, however, said she would not take up either proposal in the House until both get through the Senate. Senate Majority Leader Schumer plans to start votes on both measures in July.
    Despite the current bipartisan progress on the infrastructure plan, the passage of the bill could still be a ways away. In the Senate, the infrastructure bill will need at least 60 votes to overcome a filibuster, which means it would require the backing of 10 Republicans and every Democrat. 11 Republicans supported the bipartisan framework, but a handful of liberal Democrats including Sen. Bernie Sanders, Sen. Ed Markey, and Jeff Merkley have signaled that they oppose the framework because it does not invest enough to address income inequality and climate change. Therefore, the Senate would need more Republican votes to offset any Democratic defect. In addition, with the August recess coming, the bill could be dragged well into the last quarter of 2021.

  • Local Governance Project: Charlottesville

    Local Governance Project: Charlottesville

    This project was undertaken with the support of the Alliance for Citizen Engagement’s Local Governance Project and the University of Virginia.

    Climate change has become a ubiquitous topic of global political discourse. Global climate change has had visible effects on the world, from shrinking glaciers, to rising sea levels and more intense and frequent weather phenomena such as heat waves and hurricanes. These changes are caused by global warming. Without human interference, energy from the sun is reflected back into space by clouds or ice or is simply released from the atmosphere, allowing the planet to properly cool. Human emissions, such as carbon dioxide and methane, trap energy within the atmosphere, interfering with the cooling process and causing the planet to warm. Since 1970, carbon emissions have increased by 90% due to industrialization, deforestation, and other impacts of population expansion, thus increasing the amount of heat trapped within Earth’s atmosphere. It’s estimated that Earth’s average temperature rose by about 1 degree Fahrenheit during the 20th century. While that might seem like a small change, it far surpasses temperature changes of past eras.

    The effects of such changes are potentially disastrous. One huge effect can be seen in changing weather patterns. As the earth’s atmosphere heats up, it collects, retains, and drops more water, causing wet areas to become wetter and dry areas to become drier. Higher temperatures increase the frequency and intensify weather disasters, including storms, floods, heat waves, and droughts. The Arctic is heating twice as fast as other regions on the planet. Due to the melting of its ice sheets, the sea level is expected to rise four feet by 2100, which threatens coastal and low-lying areas. Finally, because of how the ocean absorbs industrial emissions, the oceans are now 30% more acidic than they were in preindustrial times. This is bad for most marine ecosystems, but coral reefs are hit the hardest by this type of drastic change. This, paired with increased ocean temperatures, leads to coral bleaching events that threaten not only coral reefs, but the marine life they sustain. 

    The threat of climate change is no longer just a future phenomenon but an active threat in the U.S. that is costing potential billions in infrastructure damages, and the loss of human life. The Fourth National Climate Assessment emphasised that more frequent and intense extreme weather and climate-related events are expected to continue to damage infrastructure, ecosystems, and social systems which provide essential benefits to communities. Key events just from this year outline the exact dangers warned about. Take the Texas flash freeze that happened earlier this year, in which Texas’ energy production infrastructure failed under the extreme cold. Wind turbines froze over, as well as important instruments at natural gas, coal, and nuclear facilities. With limited to no power, this caused thousands of Texas residents to fend off the historic cold by themselves. Another example is the heat dome that covered the Pacific Northwest earlier this summer. With record breaking heat in a place whose infrastructure wasn’t built to deal with such extremes, power lines and other essential items began to melt, causing outages and dangerous situations. These events aren’t simply random, but are results of how climate change is beginning to cause situations in which the U.S. is unprepared for. 

    Virginia will not be immune to the impacts of climate change, according to a report by the NRDC. Temperature increases have led to a trend of worse heat related illnesses in city areas such as Richmond and Charlottesville, averaging 3 degrees Fahrenheit hotter than in rural areas. Poorer, urban communities are disproportionately hit due to a lack of airflow, heat sinks, and poor cooling infrastructure. On top of this, coastal regions such as Norfolk are experiencing more flooding, damaging vital infrastructure. The Virginia Clean Economy Act of 2020 was passed, and heralds a progressive policy agenda toward fighting Virginia’s emissions. The main point is that it requires Dominion Energy Virginia (the main energy supplier in VA) to become 100% carbon-free by 2045 and Appalachian Power to be 100 percent carbon-free by 2050. Along with this the act requires nearly all coal-fired plants to shut down by 2024. 

    On the local level, Charlottesville has its own set of issues when it comes to the effect of climate change. According to the C3 Releases Report on Local Effects of Climate Change, published July 1, 2020, the most pertinent climate hazard for Charlottesville will be precipitation. From the 1890s to the 2010s, the average number of days with extreme rainfall per year has increased by 78%. Precipitation is predicted to become less frequent but more extreme due to rising temperatures. Aside from lost assets and damages caused by climate change-induced extreme weather, flooded buildings could lead to conditions for developing mold and poor air quality, thus imposing further costs on infrastructure and health. Second, according to the report, the average daily maximum temperature in Charlottesville is predicted to increase from 70°F to 78°F in the next 80 years. A major threat in this increase are the days of extreme heat. Historically, Charlottesville has had an average of 1 day per year qualifying as extreme (105 degrees and over), but it is predicted that this number could increase to 47 by the end of the century. Extreme heat is dangerous because it could cause heat exhaustion, stroke, and even death to those in at-risk categories (the young and the elderly, and those below the poverty line). With more negative impacts on biodiversity, the agriculture industry, and energy bills, it is obvious that Charlottesville (as well as the world) can no longer prevent the climate crisis since it has already begun. But, with decisive policy and advocacy action, the damage can potentially be mitigated. 

    The government of Charlottesville has already begun the fight against climate change and emissions. The City of Charlottesville adopted a greenhouse gas reduction target on July 1, 2019, in which the goal is to reduce community-wide greenhouse gas emissions by 45% by 2030 and reach carbon neutrality by 2050. Next, they began the development of a climate action plan for greenhouse gas reductions followed by a climate hazard risk assessment. Community engagement to develop a Climate Action Plan was planned to begin in 2020, but was delayed due to the coronavirus response and is currently being organized (although it is technically in phase 1). In collaboration with C3 and LEAP, the city of Charlottesville rolled out its Voucher Energy Efficiency Pilot program, which incentivizes landlords to accept low-income housing vouchers for energy-efficient upgrades (for example, replacing an HVAC system or new insulation), thus improving the energy efficiency of living spaces. 

    Advocacy groups have been working closely with the local government and businesses to help push for sustainability programs. The Community Climate Collaborative (C3), aside from policy research and its pushing of the Climate Action Incentives, have also put in work in the creation of the Green Business Alliance (GBA) and the Home Energy Challenge. The GBA is an group of 16 mid to large level companies that aim at combatting their emissions and energy efficiencies, with a plan to reduce their collective climate emissions by 45% by 2025. C3 supports the GBA members by tracking their energy use, facilitating solutions as a group, and highlighting success. C3 also promotes the Home Energy Challenge, in which they facilitate and organize neighborhood groups. These groups then choose from an array of climate actions complete those actions within a 6-8 week timeframe, with an ability to see their collective impact to local emissions. C3 helps with encouragement and organization in this program to incentivize community members to create sustainability centered lifestyle changes. This is a particular focus because research has shown that 30% of community-wide emissions in Charlottesville come from familial lifestyle choices, such as energy inefficient appliances, transportation decisions, etc. 

    FOCUS: WATER AND ENERGY USE


    In 2019, the City of Charlottesville solidified plans to reduce community CO2 emissions by 45% of 2011 levels by 2030 and to be carbon neutral by 2050. In 2011, the Charlottesville community produced 459,309 metric tons of CO2, meaning emissions must decrease to about 206,689 metric tons of CO2 by 2030 or at a rate of -18,044 MTCO2/year. Since then, the City has reduced its municipal emissions by 37.5% from 2011 to 2020. 

    Policy Proposals – Information Campaign & Online Tool

    81% of the City’s greenhouse gas emissions come from electricity usage, so reducing overall electricity consumption by improving energy efficiency is the most effective way of reducing greenhouse gas emissions. From 2011 to 2016, community carbon emissions decreased by approximately 21.2%—from 459,309 metric tons CO2 to 362,192 metric tons CO2. In line with the City’s 2019 plans on cutting emissions, Charlottesville needs to reduce emissions by an additional 23.8% of 2011 levels to meet their goal of a 45% decrease in emissions by 2030. This works out to a 11,107.4 metric tons CO2 per year decrease over a 14 year period. 

    Moving forward, the City of Charlottesville can help offset greenhouse gas emissions by reducing overall electricity consumption. In 2016, 29.8% of community-wide CO2 emissions originated from residential energy use, which is the highest segment of emissions in the city. At the current moment, there are 43 incentives available to Charlottesville residents—14 of which are local—to improve the energy and water efficiency of their homes. The bulk of these incentives comes in the form of rebates for installing new, energy efficient systems in residences, like programmable thermostats and HVAC upgrades. 

    While these local climate action incentives provide residents with additional, more affordable options for upgrading their home energy and water systems, these incentives are not adequately advertised to residents by the local government. Besides having a dedicated webpage for all local, governmental rebate programs, the City is lacking in its current outreach to citizens who may be interested in or willing to install new systems due to these government rebates. 

    To increase the number of residents that utilize the incentives available on the local, state, and national level, Charlottesville should invest in an information campaign and an overhauled system for sorting out incentives for which citizens qualify. 

    INFORMATION CAMPAIGN

    The information campaign will ideally be carried out in a universal manner that provides residents with a concise list of available incentives sent out in the mail and advertised on City government social media accounts. Such a program would fall under the jurisdiction of:

    • The City Department of Communications, which would coordinate disseminating information
    • The Environmental Sustainability Division of Public Works, which would compile necessary information on environmental incentives.

    To ensure that the program is effective, all information campaign resources should:

    1. Provide concise information about rebates available to residents 
    2. Be provided in both English and Spanish
    3. Emphasize and/or quantify the material benefits to residents (like estimated savings on energy per year)
    4. Provide helpful resources for how to participate in programs (like phone numbers, websites, and/or email addresses)
    5. Place special consideration on low income households to inform them of low- to no-cost energy and water system upgrades

    With these specifications in mind, the City of Charlottesville could decrease overall CO2 emissions and water usage by making the incentives for residents more apparent, mainstream, and readily available. Additionally, since many of the incentives currently available to Charlottesville residents are targeted towards low income households (12 in total), the City could improve the material conditions of low income residents—while reducing energy and water consumption–by advertising said incentives through the proposed information campaign. 

    WEBPAGE OVERHAUL

    In addition to funding a robust informational campaign about the environmental incentives available to residents, Charlottesville could increase participation in said local, state, and national incentives by creating an online tool that helps residents determine which incentives they qualify for. 

    Ideally, this online tool would be hosted and/or advertised on the Charlottesville City website and in the information campaign resources. The online tool would prompt residents with questions about their income range, their current HVAC, energy, and water systems, and the age of their home. After completing the questions, the online tool would provide citizens with a list of incentives they qualify for along with helpful links to get started. 

    The proposed online tool would be advertised through:

    1. The City of Charlottesville website (especially on the home page)
    2. The proposed information campaign outlined above
    3. City government social media accounts

    In total, this online tool would increase participation in local, state, and national programs to improve the efficiency of homes across Charlottesville by helping residents decide which incentives they qualify for in a simple, easy to understand way. 

    ONLINE TOOL MOCK-UP


    • Startup page provides information on how to use the online tool and its purpose
    • FAQ page available in case residents have questions on usage and how their data is used
    • Press ‘Explore’ to begin the online questionnaire

    • Always available help button in bottom right corner
    • Progress shown on left side of page


    Focus: Green Infrastructure and Sustainability


    Written by: Luke Aminuddin

    Fig. 1: Percent population growth in metropolitan of Virginia between 2010-2020

    A 2020 population study by the Weldon Cooper Center at the University of Virginia identified the city of Charlottesville as the third-largest-growing metropolitan area in Virginia; it experienced a 10.4% population increase between the 2010 Census and the 2020 Census estimate (see fig. 1). 

    Charlottesville is developing as a central hub for economic and social opportunities. But this also presents new challenges as more people settle in the city and new developments sprout up. Specifically, the urbanization of Charlottesville over the last decade has raised concerns about environmental health and the need for more sustainable practices. During the last two decades, Charlottesville has made important strides to make the city ‘green’ and adopt more sustainable practices. One important sustainable measure that Charlottesville has prioritized is green infrastructure, a term that originated in 1995 publication with initial practical applications in Florida. Green infrastructure is an ecological perspective that stresses the connectivity and multi-functionality of green spaces with “infrastructure” including both natural and nature-mimicking structures. Some examples of green infrastructure are urban tree canopy coverage and green roofs with benefits including the improvement of water and air quality and the mitigation of the urban heat island effect. While green infrastructure projects can be found around the world, the high costs for installation and maintenance have so far limited their proliferation. 

    Charlottesville offers a green roof building permit fee reduction and has established an initiative to be a “Green City” by 2025. However, there is much more the city of Charlottesville can do to achieve its goal of being a “Green City.” After further outlining green infrastructure, its benefits, and describing past actions on the state and local levels, this policy solution will introduce new incentive measures to further encourage the use of green infrastructure and will provide target areas of need in Charlottesville. 

    Green Infrastructure Defined: the Benefits and Drawbacks 

    According to the EPA, green infrastructure (GI) is a “cost-effective, resilient approach to managing wet weather impacts that provides many community benefits.” Furthermore, Section 502 of the Clean Water Act describes green infrastructure as the “the range of measures that use plant or soil systems, permeable pavement or other permeable surfaces or substrates, stormwater harvest and reuse, or landscaping to store, infiltrate, or evapotranspirate stormwater and reduce flows to sewer systems or to surface waters.

    GI can be categorized in two main forms. Natural green infrastructure includes trees, shrubs, grass, and soils. Green stormwater infrastructures are engineered systems that mimic natural processes to treat stormwater and also provide habitats, especially as part of the physical infrastructure of a building. A green roof is “a layer of vegetation planted over a waterproofing system that is installed on top of a flat or slightly–sloped roof.” Green roofs are categorized as extensive (lightweight, thin soil, and little-to-no irrigation) or intensive (deep soil, irrigated, and better for plants). Green walls include green façades, where climbing or hanging plants reside on a wall, or living walls, where vegetation is integrated through a wall cladding technique. Living walls are better suited for tall buildings.

    Fig. 2: A living wall system featured at the Caixa Forum in Madrid, Spain

    GI can positively impact the environment, as well as provide social and economic benefits. Most notably, GI systems help manage stormwater by retaining and filtering rainwater, which can reduce runoff by 54-62%. In detail, a UK study conducted by the University of Sheffield and the University of Leeds showed noticeable and quantifiable differences between roofs constructed of vegatitative material and ones made of non-vegetative material. Specifically, for most wet weather events, the vegetative roofs detained up to 60% of runoff compared to 40% for unvegetated roofs. Also, vegetative roofs during large rainfall events retained 5-10mm more water than unvegetated roofs. Furthermore, research conducted in Charlottesville by the Green Infrastructure Center, Inc. (GIC) showed similar results. In more urban parts of the city, high runoff has continuously introduced harmful pollutants to the Rivanna River, an important tributary of the James River. The main solution to this problem is maintaining and increasing the urban tree canopy coverage, which can reduce runoff anywhere between 2-7% (see page 8 of the City GreenPrint 1.0). 

    In some cases, these vegetative infrastructure solutions provide habitats to wildlife. University of Southampton research revealed that green walls have proven benefits for biodiversity by providing a habitat for invertebrates and nesting, food, and sheltering for local birds. Moreover, green walls can support biodiversity in cities by acting as a “corridor” to facilitate movement for local species. Urban noise reduction is also a significant benefit of green  infrastructure systems as green roofs can provide pronounced sound absorption by muffling noise vibrations between 250 Hz and 2000 Hz. Meanwhile, another benefit provided by green roofs is the mitigation of the urban heat island effect. A Columbia University study comparing green roofs with highly-reflective white roofs and traditional black roofs showed that green roofs performed better at retaining heat and reducing heat dissipation. In the winter, thermal oscillations reached a peak of 10 °C for green roofs compared to peaks of 40 °C and 30 °C for black roofs and white roofs, respectively. Similarly, in the summer, green roofs reduce heat dissipation and guarantee low temperatures with thermal oscillations of less than 20 °C. Although white roofs performed similarly to green roofs in the summer with thermal oscillations of about 30 °C, the daily thermal oscillation for black roofs was recorded around 60 °C. The heat retaining technology and reduced heat dissipation rates in green infrastructure also play a role in reducing energy usage for buildings. Green walls can reduce energy usage by 58.9% and 33.8% energy savings for green façades. 

    Another positive development of green infrastructure is the improvement of air quality in surrounding urban areas. Especially in regards to green walls, GI can improve air quality by increasing air flow rate, which facilitates improved bio-filtration. Specifically, green walls and other GI systems aid in reducing the releasing of volatile organic compounds, inorganic gaseous compounds, and carbon dioxide from buildings. Finally, beyond environmental benefits, there are social and economic benefits of GI as well. Namely, this includes the increase of the economic and aesthetic value of buildings and public spaces. Green infrastructure improvements can provide an escape from the urban jungle while creating opportunities for community cohesion and improvements to health and well-being through the planting of vegetables and fruit trees.

    Many public and private investors are hesitant to install or maintain GI systems. The main hindrance is the high costs involved with installation and maintenance. Depending on the typology, a green roof can cost anywhere between 60-600 $/m­­­­­­2. Meanwhile, green façades can cost 12-940 $/m­­­­­­2 and 350-3290 $/m­­­­­­2 for living walls. Hence, many investors are discouraged because the perceived environmental, social, and economic benefits are outweighed by the high short term implementation costs. In order to encourage the use of green infrastructure, governments around the world have developed incentive policies like financial subsidies, tax and interest rate reductions, reduced cost and timeframe to obtain construction permits, sustainability certifications, and obligations by law.

    Past Actions on the State and Local Levels

    Virginia passed 9VAC25-890-40 to provide permits for towns, cities, universities, and other institutional organizations like the military and federal facilities in order to collect stormwater and ensure improved water quality. VA code § 58.1-3852 defines green roofs and provides counties, cities, and other localities with discretion to grant incentives or provide regulatory flexibility for green roof installations. 

    Charlottesville has established its own green roof building permit fee reduction. This incentive policy applies to commercial/non-residential and residential properties and allows for up to a 50% reduction to the building permit fee if a green roof is constructed. According to Home Advisor, the average national cost for building permit fees is about $1,330 and can run as high as $7,500 in some cities, so a 50% reduction is very sufficient. Moreover, Charlottesville has also established ambitious initiatives and plans to make the city more environmentally sustainable. The Strategic Plan outlines five goals to make Charlottesville, one of which promises to create “A Beautiful and Sustainable Natural and Built Environment.” Additionally, the Charlottesville City Council created a vision statement that promises to make Charlottesville a “Green City” by 2025.

    An important contributor to increased sustainability and the encouragement of green infrastructure in Charlottesville is the Green Infrastructure Center, Inc. (GIC). GIC has expanded GI systems in Charlottesville by mapping urban tree canopies, creating and protecting habitat patches, which provides benefits for ecosystems and wind protection for buildings, maintaining current parks and trails and enhancing micro habitats. But the most important benefit, according to GIC, of establishing green infrastructure in Charlottesville is stormwater management. 

    Policy Solution: New Incentive Policies and Target Areas

    Property tax reduction: Brazil implemented a property tax reduction to incentivize households to adopt green infrastructure. In the IPTU Verde” program in Salvador, when a green roof is installed, property taxes are reduced by 5-10% for a 3-year period which can be extended. Closer to home, New York City also has a property tax reduction incentive policy to promote green roofs. In this case, an owner can receive a one-year tax abatement, which entails tax relief of $4.50/ft2 of constructed green roofs with a maximum tax abatement of $100,000.

    Mandatory GI regulations: the government could require new commercial, institutional, and residential developments to install green roofs. This is the second most popular policy used to encourage green roofs. The city of Toronto requires green roofs to cover 20-60% of the rooftop area. Meanwhile, despite some backtracking, the state of California became the first U.S. state to require solar roofs for new housing developments. 

    For the city of Charlottesville, it is imperative to consider either or both of these policy types in order to encourage the adoption of new green infrastructure systems. As such, it is recommended that Charlottesville provides a property tax reduction of a minimum of $200 annually and up to $1000 annually for a 2-3 year period for new green roof installations. According to Zillow, the average real estate property price for homes in Charlottesville is about $395,666. Being that the real estate tax for properties in Charlottesville is $0.95 per $100 of value, a minimum of $200 off of property taxes is reasonable. Cases for property tax reductions should be assessed individually based on a number of criteria including the extent of the green roof, the value of the property, and the total price of other expenses involved in green roof installation. Also, it is strongly encouraged that Charlottesville considers adopting and enforcing a green roof mandate for new commercial and residential developments. This policy will be similar to the solar roof mandate established in California. While it is not feasible to expect every building in the city to install green roofs or walls, there are particular neighborhoods that should be considered including Johnson Village, Fry’s Spring, Belmont, Martha Jefferson, Locust Grove, and UVA off-Grounds living near and around Rugby Road. These areas, according to CityGreen maps (see fig. 3), lack green stormwater infrastructure. In order to achieve Charlottesville’s goal of becoming a “Green City” by 2025, these areas should be assessed and considered for new green infrastructure projects.

    Fig. 3: Map of current green infrastructure projects in Charlottesville

    Comparison and Implementation

    All three policy proposals—the Webpage Overhaul, the Information Campaign, and the inclusion of New Incentive Policies to support Green Roofs and Walls—have the potential to mitigate the impacts of climate change in Charlottesville. However, when compared by equity, cost, and effectiveness, the idea for a Webpage Overhaul has the greatest efficacy. 

    The Webpage Overhaul and the Information Campaign are both equitable solutions for the citizens of Charlottesville. They are an extension of preexisting Climate Action Incentives which already gear some of their benefits toward low-income households in order to supply affordable and energy efficient home appliances (many providing free programs, assessments, and installments to families who meet the income requirements). Many of the programs can be accessed despite a low-income status, and are meant to help those who do not have the means to adapt their homes to be more climate conscious. The New Green Infrastructure Incentives would only be affordable to corporations, willing landlords, and the wealthy. As stated, while green infrastructure like green roofs are effective in dampening a slew of environmental negatives, they are also expensive. Even with the proposed incentives of a property tax reduction and regulations, disadvantaged families would be left behind since those incentives might not be enough to breach the gap of what they’re willing (or able) to pay. 

    When considering cost to both the government and citizens, the New Incentives for Green Infrastructure is the most expensive. Any new incentives, be it payouts or tax reductions, are lost revenue sources for the government, and any implementation of green infrastructure would be a financial burden to those citizens who take advantage of it. The other two policy proposals are merely rebrandings of preexisting costs and therefore don’t substantially increase government expenses. A Website Overhaul would be more expensive then an Information Campaign given the technical expertise and programming needed for the website, and so technically the Information Campaign is the cheapest of the three. 

    In terms of immediate effectiveness, the Webpage overhaul beats out even the Information Campaign. While the Campaign might help spread the message, it attempts to make the options more well-known rather than streamline the process of utilizing them. The Webpage Overhaul, on the other hand, takes a potentially confusing process and streamlines it for easy use, resulting in increased utilization of the Climate Action Incentives. However, to be most effective these policies should be used in tandem. The Green Infrastructure could take years to implement, both with the bureaucratic struggle of creating new incentives and the actual implementation of any Green Infrastructure. The benefits of the proposal would also take years to kick in and thus should not be the immediate focus of attention.


    While the Webpage Overhaul is low cost, equitable, and effective in the short term, the other two policies should not be dismissed. The Information Campaign should be used together with the Overhaul in order to maximize the usage of the Climate Action Incentives, optimizing those pre-existing policies. At a certain point, the Climate Action Incentives will reach a cap of how effectively they battle emissions, and new policies and ideas will need to be implemented to further combat climate change. This is where an emphasis on Green Infrastructure comes in. The idea has many benefits and should be implemented for the reasons stated in the description of its policy proposal, as it can be more effective in the long term at helping Charlotteville become a green city.

  • No Knock Warrants

    No Knock Warrants

    Historical Context

    No-knock warrants were established in the 1970s to combat the War on Drugs, “a series of federal and local policies aimed at cracking down on recreational drug use.” Before no-knock warrants, knock and announce warrants were mandatory for law enforcement to enter a home. The origins of such warrants come from Semayne’s case in 1604 and Miller vs. the United States in 1985, which prohibited citizens from being arrested in their homes without their given notice of authority and purpose from officers. Eventually, Wilson v. Arkansas in 1995 and Richard v. Wisconsin in 1997 made exceptions for unnecessary announcements.

    No-knock warrants can only be issued by a judge and allow law enforcement to enter the property of a resident without announcing who they are. These warrants are typically issued if officers have probable cause to believe that

    (a) notice will likely lead to the quick and easy destruction or disposal of evidence subject to seizure, 

    (b) notice will endanger the life of the officer or another person, 

    (c) notice will allow the person who is to be arrested to escape, or 

    (d) if such a notice is useless. 

    Therefore, it is at the discretion of the judge and law enforcement to determine probable cause, the type of warrant, and its execution. 

    No-knock warrants have been controversial since the 1970s because the execution of such warrants is dangerous for officers and civilians. The Castle Doctrine and Stand Your Ground are examples of state self-defense laws in the United States where civilians have the right to defend themselves using deadly force in their homes and surrounding areas. Standing your ground is legal in 23 states. Since 30% of Americans own guns, law enforcement officials who use no-knock warrants and civilians are at an increased risk for harm. 94 civilians and 13 law enforcement officers died in no-knock and quick-knock raids in the U.S. between 2010 and 2016, and many more were seriously injured. No-knock warrants also add financial strain to civilians because they are responsible for repairing property damage resulting from no-knock warrants.

    In the past four decades no-knock warrants have been used with increasing frequency. In the early 1980s, no-knock or quick-knock warrants were used about 1,500 times. By 2010, no-knock warrants were used about 60,000-70,000 times. 

    Breonna Taylor Incident

    On March 13, 2020, seven officers  entered the home of 26-year-old Breonna Taylor while she was sleeping alongside her partner, Kenneth Walker. The officers used a no-knock warrant, expecting to find money and drugs belonging to a previous partner of Breonna at her residence. Unbeknownst to these officers, her previous partner was put into police custody earlier that same night.

    After repeatedly crying out and hearing no response, Walker grabbed his registered gun as the police entered the home with a battery ram. While Mattingly claimed to have announced police identity, Walker along with other witnesses did not report hearing such an announcement. Walker aimed his gun at what he thought was an intruder, and fired once. Sergeant Mattingly, Officer Myles Cosgrove, and Detective Brett Hankison fired a total of 32 rounds, six of which hit Taylor. Hankinson was later charged for “wanton endangerment” after firing into the apartment of one of Taylor’s neighbors. 

    No-Knock Warrant Reform 

    On June 6, 2020, Republican Senator Rand Paul (R-KY) introduced the “Justice for Breonna Taylor Act,” federally banning the use of no-knock warrants. In addition, this act would ban the use of no-knock warrants in state and local law enforcement agencies that receive Department of Justice funding. Although the bill received bipartisan support, it did not receive a vote in Congress.

    Kentucky lawmakers have passed a series of bills concerning these warrants. “Breonna’s Law” was passed in June 2020  by Louisville Metro Council. It bans the use of no-knock warrants and requires officers to wear body cameras during searches in Louisville.  Two months earlier, Senate Bill 4 was signed into law by Kentucky Governor Andy Beshear, banning the use of no-knock warrants except in certain situations. Many other states and jurisdictions have followed Kentucky’s example and made similar changes in police legislature.

    Despite these changes to policing, many oppose the total banning of no-knock warrants. The Director of the Virginia State Police Association Wayne Huggins stated that the element of surprise is one of the advantages of no-knock warrants. Others find such warrants effective in deterring crime. NYPD commissioner Dermot Shae rejected the call to ban no-knock warrants because they kept the city of New York safe. NYPD claims no-knock warrants are primarily used to target guns. Of the 1,800 search warrants issued in 2020 by the NYPD, 1,100 were no-knock warrants. They led to the seizure of more than 800 guns. 

  • Understanding Vaccine Passports

    Understanding Vaccine Passports

    A vaccine passport is documented proof that someone has received immunization against a specific disease. With the creation of a Covid-19 vaccine, vaccine passports are now being discussed on a local, national, and international level. Vaccine passports have been debated in the United States since the 19th century, when proof of immunization against smallpox (in the form of a scar on the left arm) was required to travel, attend schools, and work certain jobs. Additionally, forms of vaccine passports already exist in the United States, such as students being required to have proof of vaccinations to attend school. According to the Biden Administration, a national vaccine database for Covid-19 is unlikely in the near future. However, different states have differing policies on the issue.

    Vaccine Passports on State, Local, and National Levels

    New York has established the Excelsior Pass which can be used to track vaccination status and whether someone has tested negative for Covid-19. The Excelsior Pass can be used to gain entry to various businesses and event venues such as theaters, sports stadiums, and wedding receptions It can be used digitally on one’s phone or as a printed paper which documents the individual’s vaccination status. While New York is the first state to implement this technology, other states such as Florida and Arkansas have passed laws which prohibit businesses from requiring proof of vaccination. The EU and Israel have implemented vaccine passports. The EU’s Digital Green Certificate provides documentation of either Covid-19 vaccination or a negative Covid-19 test and allows for members to freely travel throughout the EU. Similarly, Israel’s Green Pass enables those who are vaccinated to enter locations such as hotels and theaters.

    Arguments Against Vaccine Passports

    One of the biggest concerns when it comes to vaccine passports is individual privacy. Some consider being forced to disclose health information an infringement of privacy. Additionally, the manner in which the data is stored and delivered could raise concerns because there are no standard federal privacy laws regarding the sharing of vaccination status. For example, if vaccine providers such as CVS and Walgreens are not held to the same standards as other medical providers when it comes to handling health information, it can create risks to individual privacy when those companies are delivering individuals’ health information to others. To resolve this,health care entities are working together to develop standards to deliver information while also maintaining individual privacy. New technology could be used to deliver the information without storing individual data, such as CommonPass  which communicates with airlines information about vaccinations amongst the travelers without providing private patient data.  

    Arguments For Vaccine Passports

    While some feel uncomfortable with information sharing, others believe the benefits to overall public health outweigh any privacy or liberty drawbacks. In 1905, the Jacobson v. Massachusetts Supreme Court case determined that it was within the rights of the states to mandate vaccination in order to protect public health. At the time, Massachusetts allowed some cities to require laws mandating vaccination against smallpox; however, Jacobson refused to get vaccinated and was fined. The matter was brought to the Supreme Court where it was determined that the states were within their rights to allow vaccination mandates. This is an important component to the Covid-19 vaccine passport discussion since it addresses the question of public health vs personal privacy. Implementing vaccine passports would help to reduce the spread of the disease by creating incentives for individuals to get vaccinated as well as ensure that those who are not vaccinated don’t spread the virus as much.

    Other Issues

    Another important aspect is equity of vaccine distribution. Lower income communities have less access to the vaccine and receive the vaccination at lower rates. Requiring vaccine passports could further harm those already disenfranchised communities by limiting opportunities that otherwise would have been open. Since the distribution of the vaccinations are not equitable, the impacts of the passports could also fall along similar lines. On an international level, higher income countries are more likely to have implemented vaccine requirements to travel, which further restricts the ability of those from lower income countries to access areas of the world.

    Potential Logistics

    After receiving the vaccination, there are several different strategies for potential vaccine passport implementation. It is possible for people to either carry the information on a card or store their vaccination records on a digital device such as their phone. Databases, either run by governments or private entities, such as those delivering the vaccines, could also be established to disseminate vaccination information. 

  • The Downfall of the Venezuelan Petrostate

    The Downfall of the Venezuelan Petrostate

    VENEZUELAN OIL: A BLESSING OR A CURSE?

    Venezuela, notorious in the global energy arena for its possession of the Western Hemisphere’s largest reserves of light and heavy crude oil along with the world’s largest reserves of extra-heavy crude oil, has experienced both the blessings and the curses associated with such resources. The Venezuelan economy became dependent on these natural resources, as is the case with many developing nations. The resulting phenomenon in which a country’s government has become overly dependent on natural resource exports and thereby neglecting to invest in other, arguably less lucrative, sectors has been coined “Dutch Disease.” Reliance on the revenues from fossil fuels has earned Venezuela the status of being a petrostate. Typical characteristics of petrostates include an elite minority concentrating power, corruption, and weak political institutions, which are reflected in Venezuela’s current political climate. This brief provides an historical overview of the current political, economic, and humanitarian crises.

    Striking Black Gold

    Venezuela’s major oil reserves were tapped into in the early 1900s, and commercial scale oil drilling began in 1917. Following the end of World War I, American and British multinational oil companies became interested in Venezuelan oil reserves and traveled to Lago de Maracaibo. The discovery of oil in Venezuela’s Maracaibo Basin in 1922 by Royal Dutch Shell sparked the beginning of the nation’s oil trade on an international scale. Consequently, by the 1930s, well-known companies like Royal Dutch Shell, Gulf, and Standard Oil had become so heavily invested in such endeavors that they ended up controlling approximately 98% of the Venezuelan oil market. Following the death of Venezuelan President Juan Vicente Gómez  in 1935, a tug-of-war ensued between foreign oil companies and the Venezuelan government in regards to issues such as taxation, regulation, and ownership. In an effort to reassert control over its own natural resource, Venezuelan lawmakers passed the Hydrocarbons Law of 1943, ultimately requiring foreign companies operating in Venezuelan territory to give half of their oil profits to the Venezuelan state.

    Political Transition, Economic Boom, and Nationalization

    Venezuela established its first stable democratic government in 1958. The oil industry, the most lucrative sector of the economy, had a great impact on the government. In the process of establishing its new government, leaders from the country’s three major political parties signed the Punto Fijo Pact, which guaranteed state jobs and oil rents would be allocated to each party in proportion to the voting results. The goal of the punto Fijo Pact was to limit political infighting and ensure the majority of oil profits went to the state.

    Venezuela was the top exporter of petroleum from 1929 to 1970. The Venezuelan Minister of Mines and Hydrocarbons, Juan Pablo Pérez Alfonzo, began advocating for a plan to enable top oil-producing countries to have greater control over their oil in 1959. In the following year, Venezuela joined Iraq, Iran, Kuwait, and Saudi Arabia to form the Organization of the Petroleum Exporting Countries (OPEC). This gave the world’s leading petroleum producers the ability to coordinate oil prices and possess greater control over their national industries.

    Venezuela established its first state oil company and increased oil company taxes to 65% of profits in 1960, in an effort to assert further control over its natural resources. Demand for Venezuelan oil grew in the 1970s when the Gulf states briefly limited oil exports due to a political crisis with Israel, and the Irananian Revolution disrupted oil exports. At this time, Venezuela’s per-capita income was the highest in Latin America. In 1976, President Carlos Andrés Pérez officially nationalized Venezuela’s oil industry, culminating in the creation of Petróleos de Venezuela, S.A. (PDVSA). PDVSA oversaw all aspects of the oil industry and foreign companies were only allowed to partner with PDVSA if PDVSA held 60% equity in joint businesses. While the 1970s were characterized by positive economic strides, the global marketplace in the 1980s began to experience falling oil prices and high inflation rates, culminating in Venezuela accruing massive foreign debt as the nation purchased foreign oil refineries that were previously held by Citgo and other well-known oil companies.

    The Blunders of the Chávez Presidency

    In the 1990s, Hugo Chávez gained popular support with a socialist platform, and became president in 1998 with the promise that he would use the wealth generated from oil reserves to reduce poverty and inequality. Upon becoming president, Chávez kept his promise by expanding social services and reducing poverty by 20%. However, many of the president’s decisions came at the detriment of the oil industry. As a means of increasing oil prices, Chávez decided to cut production, meanwhile PDVSA hoped to increase oil production so that the heavy oil fields could be further developed. PDVSA officials argued against increased political control over the institution. They claimed that taking revenues from the oil industry without reinvesting funds in infrastructure and exploration of other avenues would be detrimental. This would prove to be true as the reduced profit reinvestment led to a significant decline in the country’s petroleum production. Countless oil workers went on strike, many of which were fired by Chávez, resulting in the loss of crucial managerial and technical expertise. As is common with the resource curse, investment in other sectors of the economy lagged because of a focus on oil.

    At the same time, Chávez worked to further promote Venezuelan oil on an international scale. The Venezuelan president hoped to strengthen OPEC and increase international oil prices. In addition, Chávez hoped to expand business endeavors to other regions, particularly in the Caribbean through the 2005 PetroCaribe Alliance. This alliance provided countries in the region, including Cuba, with crude oil and refined products under more favorable terms. This agreement aimed to promote regional economic cooperation and counterbalance US influence in the Caribbean.

    Chávez’s Legacy and The Rise of MaduroChávez’s presidential reign came to an end in 2013 when he died of cancer; however, his decisions would prove to have long-standing consequences. During his presidency, Chávez paved the road toward authoritarianism for his successor, Nicolás Maduro, by ending term limits, controlling the Supreme Court and the press, as well as nationalizing private businesses and foreign owned assets.

  • Russian Economics – Domestic and International Developments, and the US

    Russian Economics – Domestic and International Developments, and the US

    Following the 1991 collapse of the Soviet Union, a state marked by its centrally planned economic system, the modern Russian state transitioned to a market-based economy. However, Russia’s economy is still significantly influenced by a powerful conglomerate of policymakers and oligarchs. 

    Economic Status of Russian Citizens

    Russia ranks 70th internationally in quality of life of citizens. Low wages are a large part of the problem; the average yearly income is roughly $11,260. Although the financial standing for the average Russian has improved over the last thirty years, 12.6% of Russian live below the poverty line. In addition, the average Russian pensioner receives a monthly stipend of $59. Because of this, many pensioners have to supplement this stipend by growing their own food. Russian currency has depreciated over the last few years. In 2020, 74 Russian Rubles were equal to 1 USD or 0.85 Euros. However, the Russian government provides free healthcare and public school education to every citizen. Thus, the average Russian is not burdened by these expenses, and can use their income for other essentials. While Russia has experienced some economic growth since 1991, there is still much to be done to improve the living standards for the average citizen.

    Image Courtesy of The Moscow Times

    Population Decline

    Due to lower birth rates and increased emigration, compounded with the Covid-19 pandemic, Russia’s population is expected to decrease significantly. Between 2021 and 2024, Russia’s population is projected to decrease by roughly 1.2 million people. This potential population decrease would have a disastrous impact on Russia’s already limited labor force, and the inability of immigrants to enter the country to work due to the pandemic has only exasperated this problem. 

    Imports and Exports

    Although Russia is quickly transitioning to a service-based economy, it is still a prominent exporter of raw materials. In 2019, Russia’s primary export partners were China (14%), the Netherlands (10%), Belarus (5%), and Germany (5%). Of these exports, wheat, iron, and especially natural gas and petroleum to western Europe were most significant. Russia must import technology from more technologically developed states to keep up. It relies on imported car and vehicle parts, medicine, computers, and aircraft technology from China, Germany, and Belarus, each state accounting for 20%, 13%, and 6% of Russia’s total imports in 2019, respectively.

    Europe relies heavily on Russian natural gas and oil, and a new pipeline called Nord Stream II is currently under construction. The Nord Stream II project will stretch from Ust-Luga, Russia, to Northeast Germany. The pipeline will strengthen the European Union’s natural gas supply security and streamline the delivery of Russian gas. The new pipeline is predicted to add 2.7 billion euros to the Russian GDP and create roughly 144,000 full-time pipeline-related jobs.

    Image Courtesy of bne IntelliNews

    Despite the tumultuous relationship between American president Biden and Russian president Putin, the former seems to have little objection to the European Union furthering its reliance on Russian energy. President Biden elected not to sanction the company behind the project, Nord Stream AG, even though engaged in sanctionable behavior, because the pipeline was almost complete. Sanctions would have a damaging effect on the United States’ European allies, who stand to benefit significantly from the pipeline.

    Image Courtesy of The New York Times

    The United States has become increasingly reliant on Russian energy as well. Given the sanctions on Venezuelan crude oil and the reduced shipments from OPEC states, Russian oil and petroleum products have supplemented the United States’ energy needs. In 2020, Russian oil and refined products accounted for a record high 7% of American oil imports and surpassed imports from Saudi Arabia. Valero and Exxon Mobil imported roughly 55 million and 50 million barrels of Russian oil in 2020, respectively.

  • Purdue Pharma Lawsuit & Its Connection to the Opioid Epidemic

    Purdue Pharma Lawsuit & Its Connection to the Opioid Epidemic

    Purdue Pharmaceuticals L.P is a private pharmaceutical company founded in 1892 that develops, manufactures, and markets medications and consumer health products. The company has been accused of contributing to the opioid epidemic by aggressively marketing its opioid medications, which are highly addictive. The opioid epidemic refers to the increasing number of deaths and hospitalizations from opioids. Opioids are a type of drug derived from opium, which is a substance from the opium poppy plant. The increased marketing and prescriptions of opioid medications contributed to an uptick of opioid addictions, thus fueling the epidemic. The multiple lawsuits against Purdue Pharma attempt to hold Purdue Pharma accountable for their contributions to the opioid epidemic.

    A Brief History of Purdue Pharma

    Purdue Pharma was founded in 1892 by John Purdue Gray M.D. and George Frederick Bingham M.D. as the Purdue Frederick Company and was later sold to members of the Sackler family. By 1995, the company was focusing on launching medications that reduced pain. The main product was OxyContin, an opioid meant to relieve chronic pain for those suffering from cancer and other chronic conditions. In efforts to successfully launch the drug, Richard Sackler, the head of the company, hosted dinner programs for physicians who were prescribing greater amounts of OxyContin. The goal became to market the drug to anyone with chronic pain, rather than just those with malignant pain. OxyContin sales reached $48 million. However, the danger of overprescribing powerful pain medications is they are highly addictive. Most who become addicted to opioids do so through prescriptions. Concern grew about the illegal use of OxyContin, as people began to seek out other means to get the drugs, and in the fall of 2000 the problem grew to epidemic proportions. Meanwhile, Purdue Pharma’s sales increased to just under $1.1 billion.

    Impacts on the Opioid Epidemic

    The opioid epidemic has three main waves – the first starting with drug companies, like Purdue Pharma, encouraging doctors to overprescribe opioids. Doctors told patients that opioids were the answer to chronic pain. However, opioids are one of the most addictive drugs on the market.  21-29% of people prescribed opioids misuse them and continue seeking them out when they are no longer needed. As a result, there were hundreds of thousands of new addictions during the 1990s and 2000s. When doctors give them to patients who don’t require them, it needlessly increases the risk of becoming addicted. The growing opioid addictions brought attention to the problem of overprescribing opioids. 

    In 2011 there was a crackdown on pill mills, or pain clinics that gave away pills for money, in efforts to decrease prescriptions. As prescription pills became more limited, drug prices rose which led to people seeking street drugs like heroin. The third wave occurred when drug dealers began making synthetic drugs, like fentanyl, that are much smaller and easier to distribute, but are much more potent. 

    The lawsuits argue that Purdue Pharma played a role in the opioid epidemic when they encouraged overprescribing opioids and engaged in aggressive campaigning that downplayed the risks of using and becoming addicted to opioids. Purdue cited a letter that stated only 2 of 11,000+ patients became addicted when given opioid medicines to validate the safety of OxyContin. In reality, as with most other opioids, it takes a while for the full pain relief effect of OxyContin to settle in. Individuals may look for ways to take the drug quicker to feel the full effects instantly. Additionally, tolerance to the drug builds over time, resulting in the person needing more and more of it to experience the same effects. This is how addictions begin and this is what Purdue Pharma downplayed when marketing the drug. In fact, Purdue Pharma spent more than $400 million in promotional spending. This aggressive campaigning helped spread the word, increase the sale of, and claim the false safety of OxyContin. 

    The Lawsuits

    What’s Next

    The new settlement as of July 7, 2021 is called the reorganization plan. It has several requirements, including:

    The over 600 companies, people, and governments with claims against Purdue will vote on the package. The confirmation hearing is scheduled for August 9, 2021. 9 states have yet to approve the deal.

    Is this solution enough? 

    This case is the highest profile case against drug makers, pharmacies, and distribution companies, which are the main producers of opioids. However, the Sackler Family didn’t actually admit to any wrongdoing. The settlement doesn’t hold the family accountable and they’ll continue to be one of the richest families in the US. Furthermore, some attorneys argue that the settlement gives the Sackler family immunity through Purdue’s bankruptcy. In addition, the harm caused by the opioid epidemic is vast and while holding a major pharmaceutical company accountable is a step in the right direction, it won’t reverse the costs of the epidemic.

    There were more overdose deaths in 2020 during the pandemic than any other year, reaching nearly 100,000 deaths. Every day around 128 people die from an opioid-related overdose. One problem that has persisted when trying to address the opioid epidemic is cutting supply, rather than focusing on reducing the demand. As a result, people resort to other more dangerous means, making that solution inadvertently further the epidemic. Perhaps more focus should be on drugs like buprenorphine and methadone, which help reduce the overdose death rate by 50% or more. In addition, naloxone, the life-saving medication that can prevent deaths from overdoses, should be widely distributed. More recovery centers, mental health resources, and training to administer life-saving medications are also needed to help combat the opioid epidemic, along with holding large pharmaceutical companies accountable.

  • How Can the United States Learn from Germany’s Housing Policies?

    How Can the United States Learn from Germany’s Housing Policies?

    The political system of Germany is a Federal democracy, functioning with similar institutions of power as the United States. The federal system has national, state, and local levels, with specific powers reserved for regional assemblies or local authorities. Similar to the U.S, German governmental power is divided into three branches: the Executive, Legislative, and Judicial. Germany also functions under a capitalist economy. Given these comparable factors of power and market influence, the United States can look toward Germany’s successful housing policies for areas of improvement for its housing crisis. 

    Rental Market

    In the U.S, 35.6% of households rent, whereas 54% of all households in Germany rent. The composition of renters also differs in each country, where German renters are often young and lower incomes but with widespread renting among higher income earners as well. In contrast, 40% of renters in the U.S. in 2019 earn less than $35,000,  and the medium income for homeowners is roughly $90,000. The largest discrepancy between these rental markets are the financial incentives. Homeownership is not incentivized in Germany compared to similar economies around the world. Mortgage interests can only be deducted from income taxes if the home is rented out. The transaction costs for home purchases are also much higher than other comparable countries, making both homeownership and frequent moves inaccessible to many Germans. Due to these policies, private, nonprofessional landlords have become an essential part of the German rental market. Public organizations and private housing companies own less than a quarter of rental dwellings. Private landlords own 62% of the rental units constructed since 2011. 

    Subsidized housing emerged in Germany after World War II, and was constructed by not-for-profit and private housing companies. These new buildings were required to rent to low-income households. Today, 90% of rental units are multifamily buildings, allowing for more affordable housing in areas with high population density. Since most of the population rents, rigorous tenant rights and protections are outlined in numerous housing laws. Leases also tend to be open ended and easier for tenants to terminate agreements than landlords. In the most densely populated regions, rent regulations are stronger to maintain the limited available units. In 2015, Berlin implemented a rent cap which prevented low-income households from paying more than 30% of income on rent. That same year, the Senate ruled that Berlin’s government would acquire 30,000 new units over the course of ten years and link rent of the new units to income of the residents. 

    Homeownership 

    Homeownership in Germany remains cheaper than other comparable countries. This is because the German economy ensures stable and affordable housing instead of letting free-market supply and demand determine the value and access to homeownership. German municipalities allow for these stable and affordable homes by relinquishing land regularly for land development that would increase the housing supply. The federal government also allots funding based on up-to-date numbers of current residents and households, incentivizing local governments to construct new housing to bring in more residents and therefore increase funding. Banks in Germany are permitted to loan up to 80 percent of property value to homeowners, forcing potential homeowners to accumulate 20 percent of property value for a deposit. On top of that, there is a large consumption tax for homeowners whereas renters are given tax breaks to maximize the use of rental units. These barriers to homeownership incentivize more people to seek out rental units or rent out properties they own. With these barriers to homeownership, renting remains accessible, affordable, and popular in Germany. In the United States, barriers to homeownership are not counterbalanced by the same robust rental market. 

    Where the United States Can Improve 

    Both the United States and Germany have decentralized states with local governments and municipalities where land-use plans implemented by local authorities are consulted and reviewed by the federal government. However, the regulations of land-use plans differ in each country. Fiscal zoning in the United States regulates land-use with the intent to minimize government spending and maximize government revenue. In contrast, municipalities in Germany seek to maximize population and therefore revenue from federal incentives with land-use regulations. This allows Germany to maintain the demand for housing while keeping prices affordable and stable. Homeownership in the U.S is viewed as an investment and a primary mode for wealth accumulation, causing underused land and hoarded property in order to maintain market values. German localities legally must provide enough land for housing in all zoning plans which are reviewed by the federal government. From 2010 to 2019, Germany provided 97 construction permits for every 100 people that entered the country. In contrast, From 2010 to 2019, the United states provided 42 homes for every 100 that entered the country.

  • Austrian Social Housing

    Austrian Social Housing

    Social housing accounts for 48% of housing in Vienna and 25% of housing in Austria. Austria’s social housing system began with “Red Vienna,” a Marxist program established in 1918 that began a period of mass housing construction, public education, and public healthcare. Vienna’s city government owns and manages 220,000 housing units which represent 25% of the city’s housing stock. The city also controls 200,000 units that are built and owned by limited-profit private developers but developed through a city-regulated process. 

    Housing Communities

    Social developments include various housing types to ensure housing accessibility for people of all backgrounds and income levels. Most complexes include typical subsidized rental housing for lower-income workers, ownership-focused homes for families, apartments reserved for refugees, and low-cost housing for students. Many also include amenities such as shops, restaurants, kindergartens and daycare centers, office spaces, and leisure facilities which enhance the quality of life for residents and encourage social integration, creating prosperous communities.

    Development Process 

    Austria’s social housing development process is rooted in adequate public funding and a competent and dedicated limited profit sector. To initiate new projects, cities buy land in areas deemed desirable near transit, job centers and schools, soliciting proposals from private developers who want to build and own the housing complexes. Cities then sell the land at an affordable price and grant the developer a favorable loan with a low interest rate and an extended repayment period to ensure the financial viability of the project. To keep up with demand, the Austrian government builds thousands of new social housing units each year which mitigates rent fluctuation and keeps prices in an affordable range.

    Rental Terms

    Social housing programs provide their residents with financial support and daily amenities which promote long-term occupation and social integration. For instance, residents’ rent never increases from their initial agreement, regardless of if their income levels increase, and they are never required to move out. This alleviates the cost-burden and financial pressure that often comes with home rental, making housing accessible for all people in Austria. As a result, many higher-income residents choose to remain in subsidized housing rather than purchase more expensive homes, promoting mixed-income communities with people from a variety of backgrounds. The desirability and affordability of Austria’s social housing encourages more residents to stay in public housing regardless of their income level or social status.

    Financing

    Austria’s social housing is financed by all parties involved in the projects to ensure that the financial burden does not fall too heavily on one sector. It is important to note that Austria’s housing system is effective because of the nation’s strong voluntary sector and its commitment to a social obligation. For instance, municipalities are legally encouraged to contribute to social housing by providing land for affordable prices, eliminating land acquisition costs for builders. Developers receive low-interest, long-term loans from housing banks whose purpose is to raise money for social housing. New construction is also partially funded by a fixed proportion of income tax, corporation tax, and “housing contributions” paid by Limited Profit Housing Associations which include public and private builders and housing cooperatives who own and operate about 700,000 units each. Housing cooperatives are associations that involve tenants, builders and municipalities who plan developments together, negotiating lot locations, financing, and construction layouts. Around one third of Austria’s total subsidies go to LPHAs and cooperatives, but altogether, 80% of all new constructed housing units are co-financed by the public which alleviates the government’s financial burden. On a ten year average, 51% of all completed projects are built by private individuals, 28% by housing associations, 19% by private housing developers and 2% by municipalities. This system is effective because of the adequate private and public funding for each sector. 

    What can the United States learn?

    Public housing policy in the United States lags far behind Austria as no federal sector exists to actively plan and build desirable public housing. For instance, in 2019, 42% of public housing properties finished their last construction before 1975, and a 2010 HUD-sponsored assessment of the nation’s public housing capital needs determined that approximately $21 billion was needed for unmet maintenance and repairs. This financial burden is left entirely on the federal government, whereas Austria acquires funding LPHAs, housing banks, and municipalities together. 

    The United States provides homeowner and renter assistance in the form of Section 8 housing vouchers, and almost all public housing is built through the Low Income Housing Tax Credit, a subsidy for private developers. Unlike Austria, however, public housing accounts for less than 1% of the U.S.’s total housing stock compared to Austria’s 25%. In addition, the U.S. provides no security for its residents; tax-credit properties are only required to remain affordable for thirty years, meaning landlords can raise rent prices out of the affordability range of their tenants as they wish, after the property is thirty years old. The United States has no mechanism for collecting adequate funding for housing, does not communicate with municipalities for sufficient land, and leaves nearly the entirety of financing up to developers who prioritize their own profits over creating affordable housing stock. 

    What keeps the United States from being able to provide long-term affordable housing is its lack of correspondence between private developers and local governments, which is rooted in a lack of a social obligation for affordable construction. Local governments are not active in creating a dialogue between prospective tenants, Public Housing Associations, and developers, allowing developers to continue to drive home prices up. Even when private developers use LIHTCs in an affordable project, they are faced with strict zoning restrictions and minimum funding leading many to prioritize higher-end construction for profit and skimp out on affordable units. In contrast, a 2013 article in Governing magazine states that “the Viennese have decided that housing is a human right so important that it shouldn’t be left up to the free market.” The U.S.’s capitalistic housing market encourages homeownership for those who already have strong financial backgrounds but leaves behind those who don’t. While the majority of those in U.S. public housing are cost-burdened, meaning they pay more than 30% of income on housing, Austrian city governments regulate rent so that none of the residents pay any more than 20% to 25% of their household income on housing. Alleviating the financial burden of housing allows residents more money for basic necessities such as healthcare, child care, and food, promoting more prosperous, equitable, and healthy communities.