Category: ACE Research

  • Signs of An Overheating Economy

    Signs of An Overheating Economy

    Healthy, growing economies experience low, steady economic growth. Both producers and consumers benefit during such periods. Issues arise when economic growth is fast for a prolonged period. This type of growth is generally not sustainable; as an economy reaches its capacity to meet the demands from individuals, firms, and the government, a harmful economic downturn is likely to occur.

    Economists look at several different indicators to determine whether the economy is stable, including indicators relating to GDP, inflation, unemployment, and borrowing levels. 

    1. Inflation: The economy is overheating when there is a large and prolonged increase in inflation. With this in mind, economists monitor core inflation, or inflation measured on a select basket of goods relating to personal consumption that excludes goods with particularly volatile prices. The Federal Reserve holds a goal for inflation of about 2% and considers core inflation above 3% over a 12-month period to be cause for concern. 
    2. GDP: Economists are primarily concerned with the level of actual GDP compared to potential GDP. Actual GDP or current GDP is the value of all final goods and services produced within an economy in a certain time period. Potential GDP refers to the maximum GDP an economy can sustainably produce given all the available resources. When actual GDP exceeds potential GDP, this is a sign that the economy may be overheating.
    3. Unemployment: Economists monitor the relationship between the natural rate of unemployment and the actual unemployment rate. The natural rate of unemployment refers to the minimum rate of unemployment a healthy economy can sustain without causing inflation. The actual unemployment rate dropping below the natural rate of unemployment can be a sign of an overheating economy; it can result in wage-driven inflation as empowered workers demand wage increases the economy cannot sustain.
    4. Market Behavior: During periods of rapid growth, individuals can become over-optimistic about their future income prospects. Sharp increases in borrowing, often caused by low interest rates, is typically a cause for concern. Unrestricted borrowing creates asset bubbles, as well as an overconfidence amongst businesses and households, prompting further investment and consumption above sustainable levels, a phenomenon known as overspeculation. Once the economy ultimately downturns, the resulting wage reductions, job losses, bankruptcies, and cuts to public service are painful. 

    Historical Example: The Great Depression

    In the years preceding the Great Depression, several of the indicators mentioned above can be identified. During the 1920s the economy was booming with an annual GDP growth rate of 4.7% and unemployment averaging just 3.7%, resulting in extreme overconfidence by individuals as well as businesses. The overconfidence spurred increases in investment by individuals and financial institutions, resulting in overspeculation. The stock market exploded due to brokers allowing customers to buy stocks on margin, resulting in asset bubbles that burst in 1929. Additionally, the rate of unemployment in the years preceding the Great Depression (3.7%) was below the natural rate of unemployment, which the Federal Reserve Bank of San Francisco recently determined hovered between 4.5 and 5.5% over the last one hundred years.

    In response to these concerning signs, the Federal Reserve engaged in extensive open market sales and hiked the discount rate in 1928-29 in an attempt to discourage speculation. After failing to control speculation, the market crashed and in the following years the Fed raised the discount rate but did not engage in extensive open market operations. It is largely believed that this disastrous policy response worsened the resulting depression. In the years following the crisis, the Fed also increased reserve requirements by 50% to impede over speculation by financial institutions.

    Historical Example: The Global Financial Crisis

    The 2007-09 crisis was triggered by the housing boom and mortgage mania, but its underlying cause was a vulnerable financial system. The housing bubble burst exposed the lack of regulation of the financial system, which created cascading consequences for the financial sector and the real economy.

    Because the United States had not experienced a major financial crisis in decades, people grew comfortable in the seemingly stable system. There were no institutions specifically protecting the system against systemic risk; there was a lack of regulation on shadow banks, incoherent oversight of commercial banks, and spotty regulation of risk-taking.

    The housing bubble emerged as overspeculation overtook the markets. In the early and mid-2000s, high-risk mortgages became increasingly available to potential home-buyers. Home prices rapidly rose through this expansion in mortgage credit, which further contributed to the number of high-risk families obtaining loans. Starting in 2000, house prices outpaced the growth of household income. Yet, homeownership reached around 65% during that period. Almost no one recognized that the health of the entire system rested on the perceived health of the mortgage market. Once people’s trust in the housing sector shifted to confusion and fear, mortgages quickly spread panic throughout the system. From their peak in mid-2006 to mid-2009, home prices fell about 30%. Real GDP fell 4.3% from its peak in 2007 to its trough in 2009.

    Once the housing bubble burst, the Federal Reserve quickly flooded the system with liquidity. The Fed introduced a series of interventions such as the extension of liquidity to nonbanks, the Term Auction Facility (TAF), and the establishment of swap lines with the ECB and other foreign central banks.

    Shortly after, Congress passed the Troubled Asset Relief Program (TARP), which provided $475 billion to restart credit markets, help struggling families avoid foreclosure, as well as stabilize banking institutions, the U.S. auto industry, and A.I.G. Once the private sector regained its confidence to invest in banks, policy makers could work to restart the economy through steps such as quantitative easing, the Recovery Act, the Home Affordable Refinance Program (HARP), and the Home Affordable Modification Program (HAMP).

    Looking Forward

    So, why does this matter now? As the federal government has unveiled various stimulus packages in response to the COVID-19 pandemic, economists have debated whether or not the large influx in the money supply could overheat the economy. Some experts worry that labor shortages and rising prices point to a long-term period of inflation. Others argue that the recovery plan meets the scale of the economic crisis and that prices will recalibrate, stabilizing inflation. Some even say that an overheating economy is not necessarily a bad thing, arguing that resulting worker benefits—such as low unemployment, upward wage pressures, and diminished discrimination—are hallmarks of a strong economy. However, most acknowledge that an economy that undergoes a period of sustained overheating is problematic as rampant inflation would cause the Fed to hike interest rates, ultimately sending the economy into a recession.

    Of the indicators discussed above, core inflation is currently the prime concern, with CPI rising 5.4% this June over last June, the largest 12-month increase since the 12-month period ending in August 2008. However, Federal Reserve chairman Jerome Powell sustains that supply chain challenges are partly responsible for the increase in CPI and those effects will be reversed when the bottlenecks unwind. Current projections from the Congressional Budget Office also show that real GDP is expected to surpass potential GDP in 2025 and remain above potential GDP through 2028. 

  • The Effect of Monetary Policies on the Unemployment Rate

    The Effect of Monetary Policies on the Unemployment Rate

    Monetary policy refers to the actions that a nation’s central bank engages in to influence the amount of money and credit in its economy. Such policies directly affect the interest rate, which indirectly affects spending, investment, production, employment, and inflation. Ideally, central banks are an independent government entity. While their operations are accountable to citizens and the government, other branches of government cannot directly control the central bank. 

    In the United States, the central bank is the Federal Reserve. Monetary policy consists of the Federal Reserve’s strategies to promote price stability, moderate long-term interest rates, and maximum employment.  The Fed works towards these goals through three primary instruments: open market operations, the discount rate, and reserve requirements. The Federal Open Market Committee (FOMC) is the Fed’s main monetary policymaking body.

    Contractionary and expansionary monetary policy are the two primary avenues of monetary policy. Contractionary monetary policy decreases the supply of money while expansionary monetary policy increases the supply of money in an economy. When GDP is high and the inflation rate is climbing, the Fed engages in contractionary monetary policy. Conversely, during periods of low GDP and high unemployment, the Fed utilizes expansionary monetary policy. 

    During periods of high unemployment, individuals’ disposable income declines from a lack of stable income. This causes the demand for goods and services to decline. Businesses tend to suffer from this decline in consumption, which is often accompanied by a drop in GDP. The Federal Reserve responds to rising unemployment by boosting aggregate demand, the sum of spending by households, businesses, and the government in an economy. Heightening the demand for goods and services— expanding the economy— increases production of such goods and services; businesses then begin to employ additional workers to meet the supply of goods demanded by consumers. 

    The Federal Reserve increases aggregate demand through the federal funds rate. Set by the Fed, the federal funds rate is “the rate that banks pay for overnight borrowing in the federal funds market.” Changes to the federal funds rate triggers changes to other interest rates in the economy. Thus, the Fed can indirectly decrease interest rates. Households and businesses are encouraged to borrow and spend, which promotes overall economic activity and growth. Specifically, the economic position of businesses improves, affording them the opportunity to hire additional workers.

    For example, in 2020 the unemployment rate more than tripled and GDP sharply declined. The U.S. economy depressed, entering a period of recession in the business cycle. Accordingly, the federal funds rate greatly declined in 2020 to increase the money supply and encourage household investment and spending. A similar phenomenon occurred during the recession of 2007-2009. The federal funds rate dips as the unemployment rate increases. Conversely, the federal funds rate remains relatively constant and increases only slightly when unemployment rates are declining. 

    While the Fed aims to reduce unemployment by increasing the demand for goods and services, a growth in aggregate demand also causes wages and the cost of goods and services to increase. This increase in the price level results in inflation. Thus, there exists a short-run tradeoff between reducing unemployment and experiencing inflation. This tradeoff is called the Phillips curve

    The inflation rate is determined by three factors: cyclical unemployment (the deviation of unemployment from the natural rate), expected inflation, and supply shocks. The addition of the latter two factors to the curve occurred following the stagflation of the 1970s. The oil crisis of 1973 highlighted the effect of supply shocks and stagflation on the long-run aggregate supply curve. Experts also realized that once inflation is already occurring, the tradeoff between unemployment and inflation disappears.

    This process can be seen during Fed Chairman Paul Volcker’s disinflation throughout the 1980s. In early 1980, inflation reached a peak of 11%. The Fed brought down the inflation rate to 4% by the end of 1983. Engineering this reduction in inflation required a loss of twenty percentage points of GDP; the U.S. experienced two recessions, one of which was the largest cumulative business cycle decline of employment and output in the post-World War II period. Disinflation is often not painless. However, the costliness of new policies to reduce inflation are often influenced by their credibility. Forecasting the results of new policies requires predicting how the public will view such policies, which is often difficult. 

    Most economists believe that the Phillips curve operates in the short run: fluctuations in aggregate demand only affect unemployment and output in the short run. Over the long-run, unemployment returns to its natural level. However, some experts argue that changing the real interest rate influences not only the actual unemployment rate but also the natural rate of unemployment. The Phillips curve represents a traditional understanding of unemployment and inflation. It continues to guide the Fed’s forecasts and policy decisions. In recent decades, the relationship between the two variables has weakened, flattening the curve. Experts have expressed concerns about the reliability of the curve as an effective tool to direct monetary policy. 

    Engaging in expansionary monetary policy for an extended period of time may allow for greater systemic risk in the system, leading to the emergence of an asset bubble. Asset bubbles occur when assets increase over a short period of time, unsupported by the value of the asset. During these periods of instability, some Fed’s decisions may increase economic vulnerability. Such was the case in the 2000s, when the Fed cut interest rates to historically low levels during the recession of 2001. While low interest rates helped the economy recover, they also played a role in easing the process of getting a mortgage and buying a home. Housing demand and home prices drove up, creating the housing bubble which ultimately burst. 

    Critics claim there needs to be stronger regulatory responses by the Fed to combat instability caused by monetary policy decisions. However, the effectiveness of monetary decisions on economic stability are hindered by the presence of lags on policy. Implementation lags are short term, influenced by the open-market operations required by policy changes to be put into immediate effect. Impact lags are more long term and are influenced by multiple factors, such as the deposit expansion process delaying, firms and businesses needing time to adjust to interest rates, and delaying effects of changes to exchange rates and net exports.

    Another long-term concern of expansionary monetary policy is that countries are increasingly susceptible to falling into the liquidity trap. This trap occurs when low interest rates align with low investment spending. To combat the possibility of a liquidity trap, the Fed utilizes expansionary monetary policies. 

    Other economists believe that central banks can further expand the economy when the interest rate hits the lower bound of zero. Lowering longer-term interest rates, for example, through forward guidance and quantitative easing can stimulate the economy. 

    Some experts argue that monetary policy affects not only the actual rate of unemployment but also the natural rate of unemployment. A clear instance of this phenomenon can be seen during recessions, which may also leave permanent scars on the economy. For example, the job search may become permanently inhibited as skills or motivation to find employment diminishes; thus, the amount of frictional unemployment increases. Moreover, real wages may be pushed above equilibrium level, leading to an increase in the amount of structural unemployment. 

    Reflection Questions:

    1. Do you agree or disagree with critics that there needs to be stronger regulatory responses by the Federal Reserve to combat instability caused by monetary policy decisions? 
    1. Would you say the Phillips Curve is a reliable tool to direct monetary policy? 
    1. Are you in favor of lowering longer-term interest rates, such as through quantitative easing, to stimulate the economy? 
    1. How would you like to see changes in monetary policy of the Federal Reserve, specifically for an indirect effect on unemployment rate? 
  • Upzoning to Create Mixed-income Neighborhoods

    Upzoning to Create Mixed-income Neighborhoods

    The Problem: Unaffordability and Sprawl

    The structure of American cities was created and has been maintained in accordance with the interest of affluent homeowners who leverage outsized political interest. Sweeping histories of residential segregation have emerged in recent years, igniting a conversation around how to remedy urban “ghettos”—predominantly Black and Latino portions of cities which feature high levels of crime, concentrated poverty, low upward mobility, and decrepit buildings. Since the political awakenings of the 1960s, experts on housing policy have recognized that mixed-income neighborhoods have the potential to substantially bridge the gap in life-quality between low and high income urban residents. Given the overwhelming evidence on the virtues of integration, why do cities in the United States remain starkly segregated? 

    Currently, the most notable source is local zoning ordinances, which determine what sorts of buildings can be built and where. Housing prices fluctuate, like any other good, in accordance with supply and demand. The hyper-localized nature of zoning decisions gives residents a stranglehold on the supply side, which chokes off new construction and drives up prices accordingly. For this reason, experts agree that the main cause of unaffordability in housing is a shortage in supply, particularly in job and amenity-rich urban areas.

    To illustrate the gravity of the problem, a few key statistics are worth noting. In 2017, 48% of all renters qualified as cost-burdened, which means they spent over 30% of their household income on rent. By the same measure, about 75% of “low-income” renters were cost burdened; the majority of whom were severely cost-burdened—meaning they spent over 50% of their income on rent. While affordability of rental housing has always been a problem for low-income people—simply by virtue of insufficient incomes and a lack of social welfare provision—the share of working and middle-class Americans who struggle to pay the rent has risen precipitously in recent years. When developers are unable to build, housing unaffordability creeps further up the income ladder to the point where middle-class households with two adults working full-time are competing with low-income families for low-quality housing. 

    In addition to the troubles of affordability and the economic insecurity that accompanies it, restrictive zoning ordinances encourage urban sprawl—a phenomenon that increases the emittance of fossil fuels and contributes to climate change. Under current zoning regimes, developers are incentivized to build high-density developments along interstate highways far from the job-rich urban centers. California presents the most notable example of this problem, which manifests itself in crawling traffic and extensive commute times. 

    Across the United States, 75% of land in urban areas are zoned for single-family housing. These portions of land are usually high in amenity—home to well-funded and high achieving schools, low in crime, bordered by leafy green spaces—and present a lucrative opportunity to developers: build big buildings and make a lot of money. In other words, the reason developers are not building is not due to a fundamental market failure, because developers would build in earnest if given permission. Rather, it is the outsized influence of local homeowners who seek to limit new building projects. 

    A legal ruling made by the Circuit Court of Appeals in 1935 denied the federal government the power of “eminent domain,” which would have given Congress the ability to override local zoning codes. Instead, zoning codes are decided on a fragmented level, with cities and municipalities passing a mixture of overarching guidelines and case by case decisions. The lion’s share of new zoning propositions are subject to debate at local town hall meetings, where interest groups and individuals can show up and advocate to support or block potential zoning alterations. Many of these alterations aim to upzone or to expand the available options for any given property—to include duplexes, triplexes, or apartments, for example—given the current highly restricted landscape. At these meetings, a very specific demographic predominates; White, affluent homeowners, who are often older men, show up en masse to block construction of bigger, more affordable developments. These neighborhood defenders are often derided as NIMBYs, an acronym for “Not In My Backyard”. 

    Even where anti-development interests fail to block construction, developers are forced to shell out on up-front costs, which creates an overall deterrent against building in neighborhoods where NIMBY interests preside. To offset expenses from environmental reviews and delays in construction, developers in strictly zoned areas choose to build more expensive units, ultimately aggravating the affordability problem.

    The Proposal: Upzoning

    To address the dual-harms caused by strict zoning ordinances—scarcity and sprawl—the government should encourage new construction of high-density housing. As mentioned, the federal government lacks the leverage to effectively compel localities to alter their ordinances, though they do have some tools at their disposal. Most of this power lies in the ability to stipulate federal funding by making it conditional on local political action. For instance, a number of senators, including former Presidential candidates Cory Booker and Elizabeth Warren, have proposed withholding infrastructure and transportation funding from cities that are not “demonstrating progress towards reducing barriers to affordable housing.” “Progress,” here, would certainly include loosening strict zoning laws. 

    Some local governments, most notably the city of Minneapolis, have swum against the tide of homeowners in order to “abolish” single-family zoning. In California, where the affordability problem is at its worst, efforts to address zoning have been met with fierce opposition.

    Whether it requires the full force of the federal government or the concentrated will of local advocacy, liberalizing zoning laws and removing single-family requirements is an essential step in addressing the housing crisis. There are, however, important arguments to note on both sides of the issue, many of which concern the operation and distribution of political power. 

    Arguments Against

    Proposals to override restrictive zoning ordinances are flanked by critics on the left and on the right, who make very similar arguments, yet buttress them with vastly different language and ideological signaling. Both argue that local control of the housing landscape affords some level of popular sovereignty over the land. From this angle, the deployment of local interests at a town hall meeting appears to be a paragon of democratic decision making; it gives citizens direct control over their neighborhood and their livelihood. These critics worry that centralized control of zoning amounts to “weakening the ability of inhabitants to determine democratically how urbanized spaces are produced”.

     On this point, NIMBY advocates also fold in an argument about the importance of individual choice, defined in the economic sense as unfettered self-interest. Neighborhood change, in this view, does violence to the homeowner’s past decision to settle down in a neighborhood zoned for single-family occupancy. Embedded in this argument is the fundamental contention over the ideal of integration—economic, racial, and otherwise—and the extent to which the ability to choose the nature of one’s lived environment is something to be desired. In its strongest form, this argument can be used (and has been used) to justify clear-cut racial segregation, simply due to the—hypothetical—fact that many White people oppose the presence of residents of color. 

    Overall, parsing the legitimacy of NIMBY interests is difficult and controversial. Research on how new density would impact the life-quality of homeowners in previously single-family zoned neighborhoods is mixed, but there is reason to think that they would sacrifice some of the benefits afforded by proximate affluence. 

    From the left flank, gentrification activists lament the pitfalls of urban renewal programs of the past, arguing that they shred the social fabric and cultural autonomy of low-income, often predominantly minority neighborhoods. They worry that new developments will displace existing low-income residents by raising rents. This alleged causal mechanism goes like this: new developments come in; the affluence of the new residents makes the areas more desirable, amenities such as business and transportation follow to cater to these new residents; the value of the surrounding land rises due to its desirability; rent for existing tenants skyrocket; low-income residents, now unable to afford such rents, are forced to relocate. Adversaries to zoning reform invoke this process—often discussed through the language of “gentrification”—to illustrate the government’s lack of attention towards people in poverty. 

    Arguments For

    The most morally forceful argument for changing restrictive zoning laws are premised on the wealth of evidence suggesting that mixed-income neighborhoods afford low-income families heightened prospects of achieving key tenets of the American Dream. Thus, many YIMBY (“Yes In My Backyard”) advocates extoll the ideal of an integrated city of equal amenities and equal opportunity—an ideal only achievable if cheaper housing is available in every neighborhood. The key variable in this vision is affordability, which would increase across the board in the view of many YIMBY advocates.

    As mentioned, there is near-consensus amongst experts that a lack of affordability springs primarily from widespread shortages in available units. In 2019, the National Low Income Housing Coalition’s annual report noted that there are 37 available affordable units for every 100 extremely-low-income renters. Constraints on new construction intended to bridge this gap contributes to rampant homelessness, particularly in Western states, and creates an affordability problem that afflicts low- and middle-income Americans. Armed with data emphasizing the centrality of housing in the equation for well-being, proponents of easing construction constraints argue that the interests of single-family homeowners who deplore new construction are outweighed by the social benefits of alleviating unaffordability. 

    Advocates of eliminating single-family zoning also note the subsidiary benefit that new construction has on housing quality. Even when targeted at households of middle and higher-income, new construction leads to a virtuous process known as “filtering.” To maximize profits, developers build high amenity, aesthetically pleasing new buildings, which attract people in the area looking to upgrade their living space. To fill units left vacant by these eager movers, landlords must adjust their prices to attract new tenants, which means that as rental prices reach a new equilibrium, some lower-income renters will end up in nicer units. Evidence suggests that this process is to some extent legitimate, but that it tapers off in areas with perpetually rising rents. 

    As mentioned above, advocates for easing zoning restrictions must contend with those whose central fear in housing policy is the process of gentrification. In response to this concern, NIMBY advocates argue that new construction prevents the so-called gentrifiers from competing with the existing population for established rental units; if they did compete, they would outbid community members on rental prices and displace tenants. With support from some evidence, they argue that loosening zoning has little impact on the displacement of existing low-income residents. Further, they support an easy solution to mitigate any displacement that does occur. Through stipulations in the new construction contracts, local governments can ensure that a sizable portion of the new development is reserved for low-income households. This strategy is formally known as “inclusionary zoning” and is popular in many cities. 

    The final and perhaps most important argument advanced by adversaries of single-family zoning regards the policy goal of encouraging the most energy efficient structures in future construction. Detached single-family homes are highly inefficient to heat and cool. Moreover, as development spreads and sprawls to accommodate the preference for single-family homes, transportation becomes less efficient—assuming, correctly in the case of most American cities, that there is not a robust public transportation network to accommodate such sprawl. In contrast, dense development accompanied by well-planned transportation systems have a salutary effect on greenhouse gas emissions. 

    Concluding Note and Questions

    It should be noted that the path forward for housing policy demands a set of complementary policies to accompany the increase in housing supply that is proposed here. In some cases, relaxed zoning laws will increase the prices of neighboring properties, which puts pressure on existing tenants and homeowners due to rising rents and property taxes. To ease this pressure and make the housing market more equitable and inclusive, programs like Section 8 vouchers and other subsidy programs should be broadened in scope to cover more households. 

    Reflection Question

    1. Should federal or local governments override the interests of homeowners and upzone to allow for denser development; or should the homeowner’s preference for their community be respected?
  • The Poverty Line in the U.S

    The Poverty Line in the U.S

    The poverty line, or poverty threshold, is the minimum amount of income that a family needs for food, clothing, transportation, shelter, and other necessities, once a year. It represents the border between poverty and non-poverty for administrative and statistical purposes. In many countries, such as the United States, this statistic is adjusted yearly for inflation. An example of the U.S. poverty line in the year 2021 is shown below. The poverty line varies according to the number of persons in a household.

     image4.png

    Source: Department of Health and Human Services

    There are two versions of the poverty line in the United States: 

    • The poverty thresholds are the original version of the federal poverty measure. They are updated each year by the Census Bureau. The thresholds are used mainly for statistical purposes. For instance, preparing estimates of the number of Americans in poverty each year.
    • The poverty guidelines are the other version of the federal poverty measure. They are issued each year in the Federal Register by the Department of Health and Human Services (HHS). The guidelines are a simplification of the poverty thresholds for use for administrative purposes. For instance, determining financial eligibility for certain federal programs such as Project Head Start. 

    Methods of Evaluating Poverty

    One of the methods to calculate the poverty line in the U.S. is the Gallup Poll. The national survey has regularly asked people to report what is the least amount of income a family needs in order to get along in their community. However, it is possible that some interest groups may ask people to inflate their answers with the expectation of higher benefits.

    The other popular method to evaluate poverty is through counting calories. The relationship between hunger and poverty remains strong, and many countries calculate poverty lines by calculating how much it costs to obtain enough food. Such calculation meets a calorie norm of around 2,000 calories a day, which is recommended by nutritional experts at the Food and Agricultural Organization of the United Nations.

    Calories can be converted into money by looking at what people spend and finding the income level at which, on average, people get 2,000 calories. This can be done by plotting what is called the “calorie Engel curve.” For example, in the United States, the poverty line was set by starting not from a calorie norm but from an economic food plan recommended by the Department of Agriculture.  

    Poverty Classification

    • Relative poverty is identified as the inability to participate in society. Relative measures of poverty are often constructed by using poverty lines that move with average income, so that the minimum acceptable income is tied to what other people get. To some people, poverty also means lack of access to education, healthcare, or even entertainment. Relative poverty is a much more complicated concept. This concept of relative poverty is often used in developed worlds.
    • Absolute poverty is simply not having enough to eat or enjoy good health, a severe lack of access to basic human needs. The basic living standards are consistent over time and globally, for example all humans need the same caloric and water intake no matter where they live. 

    The 2001 poverty line in the United States for a family of two adults and two children was $18,000 a year, more than ten times as much as the international “extreme poverty” line of $1 per person per day used by the World Bank and the United Nations. 

    The poverty line is used today to decide whether the income level of an individual or family qualifies them for certain federal benefits and programs. There are numerous United States policies regarding the poverty line, such as the recently passed American Rescue Plan by the Biden Administration. President Biden’s healthcare proposal aims to expand the Affordable Care Act so that 97% of Americans are insured, and will cost $750 billion over 10 years. It would include a public health insurance option like Medicare, which will be available premium-free to individuals in states that haven’t expanded Medicaid and to people making below 138% of the federal poverty level. It would also eliminate the 400% federal poverty level income cap for tax credit eligibility and lower employees’ maximum contribution for coverage to 8.5%. Many federal programs, such as the National School Lunch Program, are created and adjusted based on the poverty line. These programs are made as an effort to make food more accessible for those below the poverty line guidelines each year. The National School Lunch Program was created initially in 1946, with about 7.1 billion children participating that year. The program has grown dramatically, with 30.4 million children participating in 2016. Depending on family income, students can receive reduced or free meals. 

    Some critics argue that measuring poverty in the United States based solely on the cost of food ignores other significant factors that may influence a household or individual’s wealth. For instance, there are a multitude of factors, such as health conditions or access to transportation, that could impact how much someone could earn or how much they must spend. If an individual has a medical condition which their insurance does not cover, their spending will be higher than an individual without such a condition, even if they have the same incomes and spending habits. 

  • The Nuclear Umbrella and North Korea

    The Nuclear Umbrella and North Korea

    Nuclear umbrellas have been a central part of US nonproliferation policy for most of American nuclear history. A nuclear umbrella, also known as extended deterrence, is when one nuclear armed country, officially says it will use its nuclear weapons to protect a non-nuclear ally, i.e. the United States guaranteeing it will retaliate against North Korea if it strikes an allied country, such as Japan. The extended deterrence policy in the United States is called an extended nuclear deterrence (END) guarantee. The US began using nuclear umbrellas during the Cold War to prevent European countries from pursuing weapons programs, and have continued to be implemented up to the present day. An END guarantee can also cover conventional forces stationed in that country. It is a comprehensive way for the US to use its military power to both protect another country and avert their need to invest in military or nuclear weapons, furthering the US goal of nonproliferation. 

    Nonproliferation has been the main goal of the United States since World War II. Extended deterrence became a tool to reach that goal in the 1950s when the United States officially offered its nuclear umbrella to South Korea for protection against Russia. This policy ended with the end of the Cold War, as Russia was no longer the biggest nuclear threat to South Korea. However, with North Korea withdrawing from the Treaty on the Non-Proliferation of Nuclear Weapons (NPT) in 1994, a new threat emerged towards both South Korea, Japan, and the United States. Nuclear umbrellas were one of the only reasons many European countries did not pursue nuclear weapons, despite many countries having both the technology and resources to make a weapons program a viable defense option. More recently, this policy has been enacted in East Asia, to deter North Korea from attacking South Korea or Japan. Because of the number of countries now relying on the US nuclear program for deterrence, the US is continuously upgrading and renewing its own nuclear program.

    For nuclear umbrellas to be effective, South Korea and Japan must trust that the United States would be willing to risk a counter strike from North Korea. Would the US be willing to sacrifice Washington to save Seoul? This is the key question to answer for any country that is offered extended deterrence. In the case of protection against North Korea, the general consensus is that it is. While credibility was not as certain during the Cold War era of extended nuclear deterrence, currently North Korea’s minor nuclear capabilities render it unlikely that they could launch a second strike against the United states successfully. This means the United States does have to sacrifice as much to offer South Korea and Japan extended deterrence. However, the more capability North Korea obtains, the less credible the extended deterrence will be. Increased North Korean capability would throw off the balance the United States has been able to find in the region.

  • Introduction to the G7

    Introduction to the G7

    History

    The Group of Seven (G7) is a group of like-minded countries who meet regularly to address pressing global issues. The seven countries’ influence on the international stage has led to further interest in their meetings and their diagnosis of the most important issues to address. 

    The Group of Seven (G7), consisting of Canada, France, Germany, Italy, Japan, the United Kingdom, and the United States, held its first summit in 1975 in response to global economic challenges. In 1944, the Bretton Woods system established the U.S. dollar as the “world currency” by requiring nations to peg their currency to the dollar which was then tied to the price of gold. In 1971, President Nixon announced the end of the gold standard in the United States and countries were left to select a new exchange agreement for currency. For example, a nation could link the value of its currency to that of another nation, “float” the currency and allow the market to determine its value, participate in a currency bloc, or adopt a new currency. 

    A few years later, the Organization of Arab Petroleum Exporting Countries (OAPEC) placed an embargo on exports to the United States for supporting Israel during the Yom Kippur War, causing oil prices to skyrocket. The rise of fiat currency paired with the 1970s recession led the world’s largest economic powers to convene and discuss the future of international economic policy with the first G7 meeting.

    From the G6 to the G8 and Back to the G7

    The G7 was initially known as the G6 before Canada joined the group in 1976. Russia then became the newest member in 1998. President Bill Clinton hoped by granting membership to Russia, he could encourage the nation’s first post-Soviet leader to develop closer relations with the West. However, Moscow’s annexation of Crimea in 2014 resulted in Russia’s indefinite suspension. President Trump suggested Russia be readmitted in 2018 but that idea was rejected by other members. 

    Initiatives

    The heads of government for each G7 nation meet annually to discuss an array of issues. The European Union participates in the annual summits as a “non-enumerated” member represented by the presidents of the European Council. The G7 is not based on a treaty and has no permanent secretariat, and the presidency rotates each year.

    The G7’s agenda focuses on the most pressing global issues, as seen by the nations involved. For example, in the 1990s the group focused heavily on the economic transition of former communist states. Although the G7 formed to discuss economic cooperation, the group evolved to address foreign policy and human rights issues as well. At the June 2021 meeting, the G7 discussed rebounding from the economic hardships of COVID-19 in a sustainable manner. They pledged to increase global vaccine manufacturing capacity, invest in recovery plans that promote economic growth, reach net zero carbon emissions by 2050, and increase access to education, especially for women. The group also launched its Build Back Better World initiative to counter China’s Belt and Road Initiative. The plan aims to provide hundreds of billions of dollars in infrastructure investments to developing countries.

    Although the G7 is not able to pass laws as a collective body, the members still work in unison to achieve their objectives. In 2002, the G7 played an instrumental role in creating the Global Fund to fight against HIV, TB, and malaria across 155 countries. G7 members have provided 75% of the Global Fund’s $45.4 billion in assistance since its creation. The effort has saved an estimated 38 million lives so far. Member nations also helped organize the Muskoka Initiative in 2010 to help reduce maternal and infant mortality and committed billions in funding. Experts projected the initiative would prevent more than 1.3 million deaths.

    Future of the G7

    Although the G7 has experienced notable success, questions remain as to whether the group is losing relevance. G7 nations accounted for 63% of the global GDP in 1975. Today, that share has dropped to 45%

    Two of the six largest economies in the world, China and India, are not members of the group despite their rising share of the global GDP. The G20, a complimentary organization to the G7, includes all G7 members in addition to India and China, among others. The group’s members make up 80% of global GDP and 60% of the world’s population. While the G7 addresses both economic and political issues, the G20 tends to focus almost exclusively on economic matters.

    Efforts to counter China, such as the Build Back Better World initiative, continue to dominate the G7 agenda. As former White House advisor and member of the secretary of state’s policy planning staff Ash Jain explained, “The G7 is being rebranded as a group of like-minded democracies, as opposed to a group of ‘highly industrialized nations.’ They’re changing the emphasis.” The effort to counter the rise of China explains the G7 as more of a “like-minded” coalition of nations rather than a forum dealing exclusively with economic concerns. 

  • Electoral Systems Around the World

    Electoral Systems Around the World

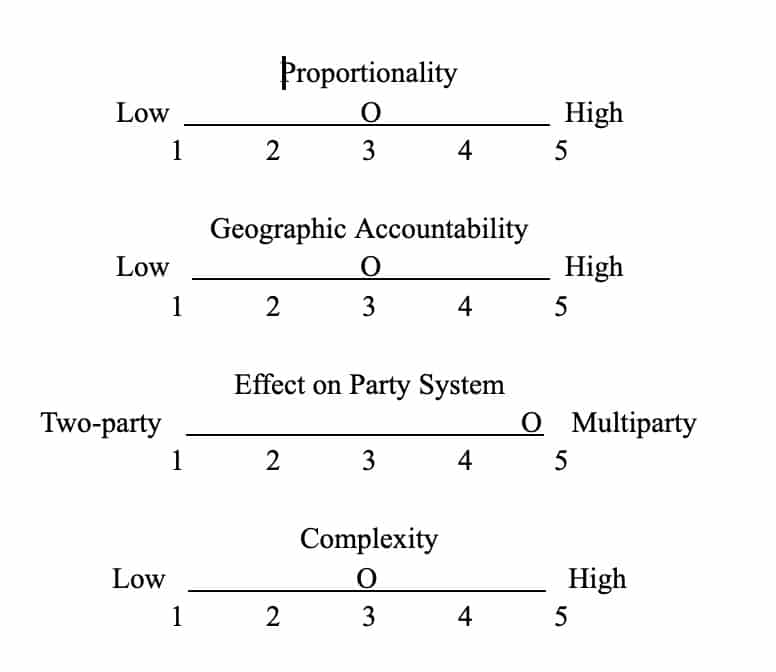
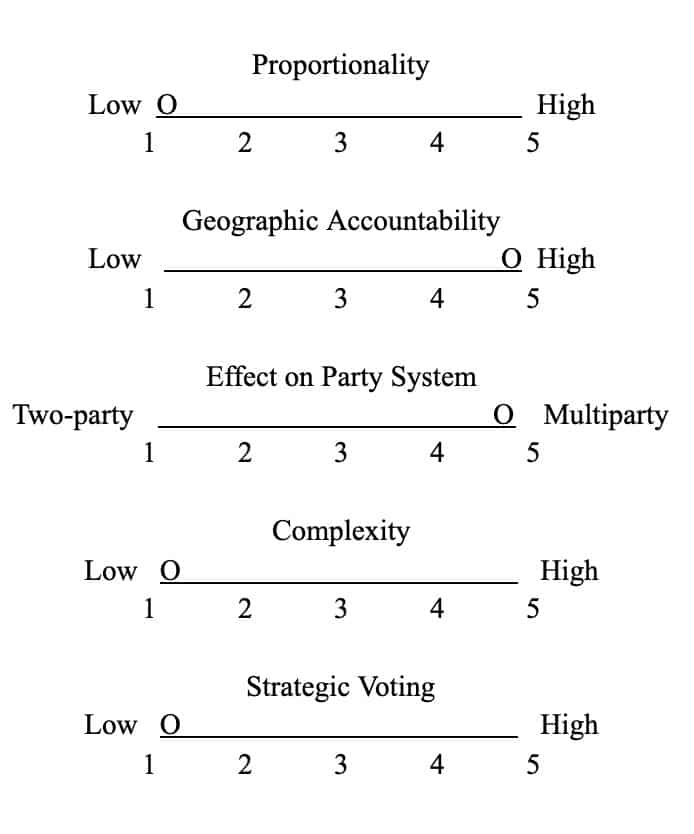
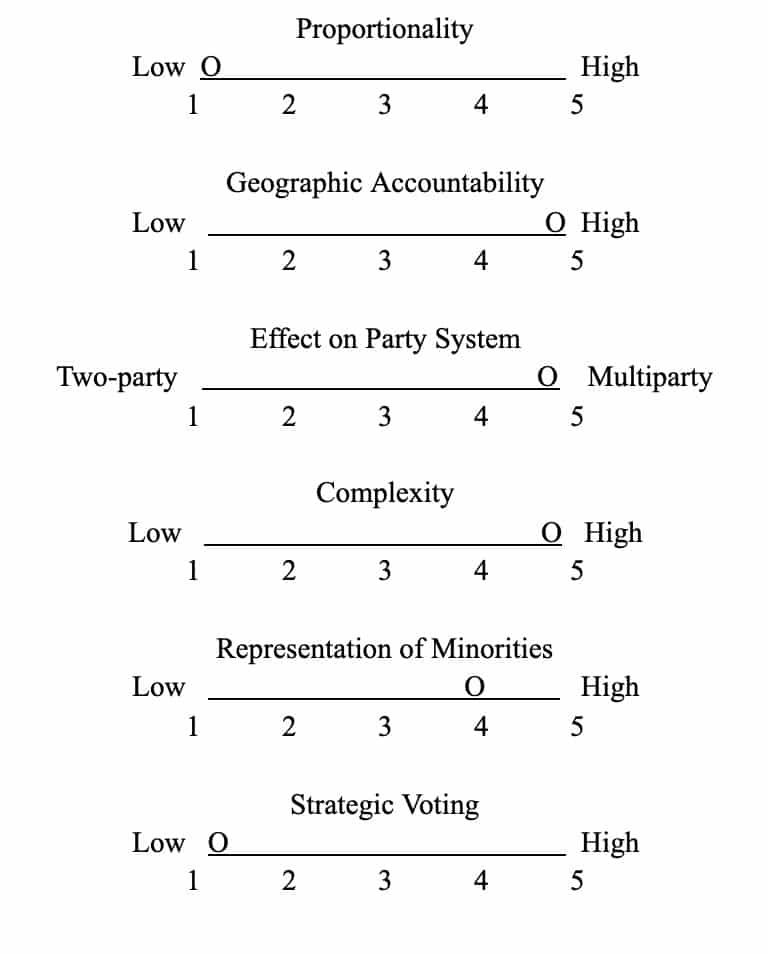
    An electoral system is a set of rules governing elections, determining how votes are counted in order to determine which candidate(s) wins the election. There are lots of ways electoral systems can vary, including how many votes are needed to win the election, whether you vote for a single candidate, party’s list of candidates, or you rank several candidates, and whether the district elects one representative or several, among others. Together, different combinations form different electoral systems. 

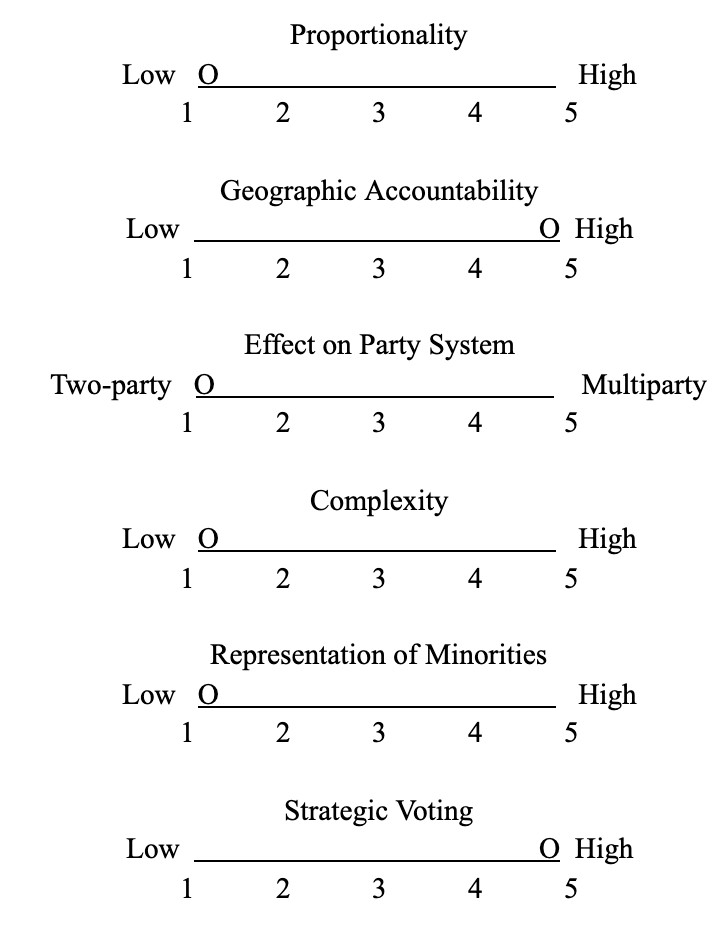
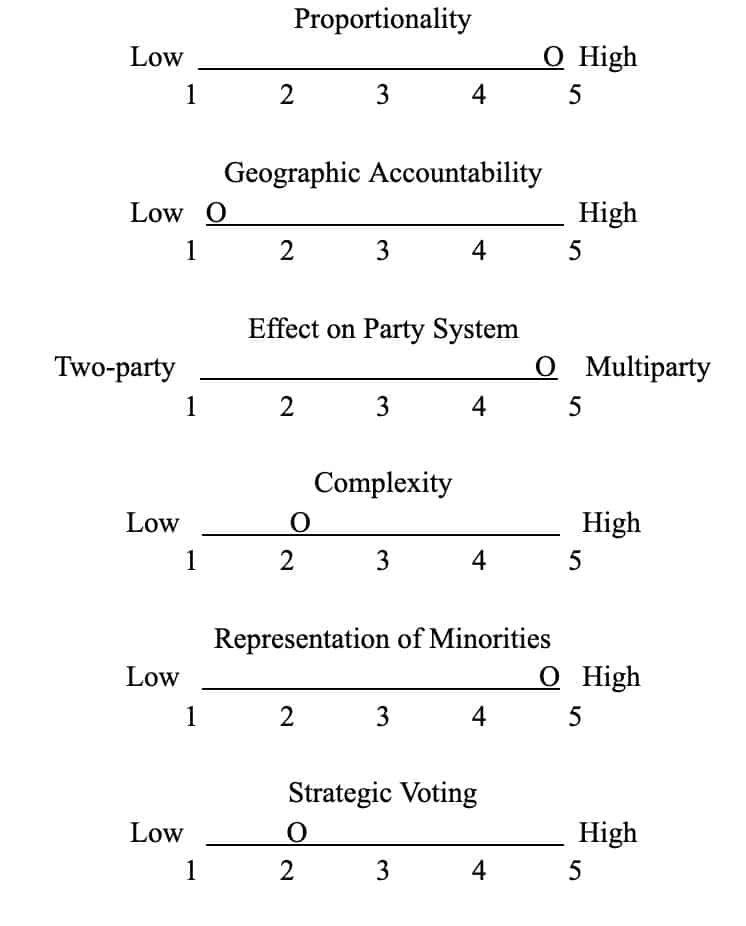
    There are also separate criteria that can be used to evaluate each system as a whole. Each criterion is best understood as a spectrum, but there is not necessarily a correct or incorrect end of the spectrum, rather all of these criteria can be good or bad depending on the context.

    • Proportionality: how closely the system translates votes won into seats won. This is most often related to what percentage of the votes is needed to win a seat. Wasted votes are votes that do not help elect a candidate.
    • Geographic accountability: how accountable a specific elected representative is to voters of a defined geographic region. This can shape how easy it is for voters to influence policy, get help with local services and issues, and remove an unsatisfactory politician from office. In general, the more representatives per district, and the larger the district, the weaker the connection.
    • Party system: the number and size of major political parties in the nation’s legislature, and different electoral systems can create stronger/weaker party systems from the same public opinion. The most common party systems are two-party and multiparty systems, both frequently found in democratic nations, and single-party systems more common in authoritarian or weak democratic states. 
    • Complexity: how much effort, knowledge, and education does it take for a voter to be informed? How many candidates or parties must a voter form an opinion on to make an informed vote?
    • Representation of minorities: does the system encourage parties to run minority candidates or a diverse list of candidates, or does it encourage parties to run a candidate who must appeal to the majority of the district, who is likely not a minority member?
    • Tactical/strategic voting: when a voter supports a candidate or party other than their most preferred candidate in order to prevent their least preferred candidate from getting elected. 

    The electoral system utilized in a country is often a product of its history. Many former colonial nations use electoral systems adapted from their colonizers, for instance many former British colonies use the First Past the Post system used in the UK. Additionally, once an electoral system is in place, it can be very difficult to change. 

    Electoral Systems

    First Past the Post (FPTP)

    In First Past the Post, electoral districts are relatively small and each only elects one representative (called a single-member district). To win a seat, a candidate needs more votes than any other candidate in the election (a plurality), which is not necessarily a majority of votes. It is possible for a party to win most or all of the seats with a much lower percentage of the vote. FPTP systems tend to develop two-party systems, because there is no benefit for coming in second (or later places), only parties that can reliably win elections survive, cutting out third parties. Voters also see the lack of success of third parties, and turn away from them, exacerbating their problems.

    Canada uses the FPTP system, and the most recent federal election was in 2019. The Canadian House of Commons has 338 districts called “ridings”. Because many ridings had several of Canada’s larger political parties contesting the election, in some ridings the winner did not get a majority of the vote. At an extreme, in one riding the winner only earned 28.5% of the vote. Some parties’ representation in the House of Commons were more proportional than others; for instance the Conservative Party won 34.4% of the national vote and 121 ridings, which is nearly the same percentage of the House of Commons. While the New Democratic Party won 15.9% of the national vote this only equated to 24 ridings, or 7% of the House of Commons.

    Proportional Representation (PR)

    In List PR, electoral districts are typically larger, but elect more representatives than any one district does in FPTP. Parties run a list of candidates in each district, and voters vote for a party list rather than individual candidates. Parties win the number of seats proportional to the percentage of votes they earned. If a party wins X seats in a district, the top X candidates on their party list are elected. Because a party does not need a plurality of votes to enter the legislature, there will often be many, smaller parties in the legislature, forming a multi-party system. However, there can be a minimum percentage of the vote needed to earn a seat.

    The European Parliament is one of the governing bodies of the European Union and is directly elected by the citizens of EU member states. Each member state elects Members of the European Parliament (MEPs) and the number of MEPs is dependent on population, currently ranging from 6-96 MEPs. Most states use the list PR system described above, though another system, single transferable vote, is also allowed. 

    Parallel Voting

    Parallel Voting is one way to combine plurality/majority systems and PR. Voters cast two votes, one in a plurality/majority election (most typically FPTP but others are possible), and one vote in a PR election. How many seats a party wins in the plurality/majority election does not affect the number of seats that party wins in the PR election, or vice versa. 

    One nation that uses Parallel Voting is Italy. Italy’s Chamber of Deputies (lower house) has 630 seats, 233 (37%) of which are elected by FPTP, while the other 397 seats are elected by PR elections in regional, multi-member districts

    Two Round System (TRS)

    Under TRS, each district elects one representative, and an absolute majority of votes is required to win, rather than a plurality as under FPTP. If no candidate initially wins more than 50% of the vote, another round of elections is held, traditionally between the top two candidates. This runoff is usually held a few weeks after the first round of elections.

    France uses TRS for both its presidential and parliamentary elections. In the French 2017 presidential election, five candidates received more than 5% of the vote in the first round, with Emmanuel Macron (24.01% of the vote) and Marine Le Pen (21.3%) leading the pack. In the runoff between the two, Macron won with 66.1% of the vote, compared to Le Pen’s 33.9%.

    Preferential Voting

    Preferential voting is also known as alternative voting or ranked choice voting in the US. Like FPTP, preferential voting elects one representative per district, but unlike FPTP, voters indicate their preferences by ranking the candidates. Voters have a first preference vote, second preference vote, etc. Some nations require voters to rank all candidates, while others do not. To determine the winner, all first preference votes are counted. If a candidate has a majority of votes, that candidate is elected. If no candidate has a majority, then the candidate with the fewest votes is excluded, and that candidate’s votes are distributed according to the voters’ second preferences. This continues until a candidate has a majority (more than 50%) of the votes and they are declared the winner. This process is also known as an instant runoff, as opposed to the more time-consuming second round of elections in TRS. 

    Australia uses preferential voting, and it has gained traction in the US in recent years (under the name of ranked choice voting.) In Australia’s 2019 federal election, 46 seats were decided on the first preference vote, while the other 105 seats were decided on later preference votes. In twelve elections, the eventual winner was not in first place after the first round of preference votes, and ten of those elections went to the Labor party.

  • The Land Value Tax

    The Land Value Tax

    In the United States, the Department of Housing and Urban Development (HUD) administers federal public housing assistance programs and distributes funding to local housing agencies. These programs aid approximately 5 million households in finding affordable housing, yet 3 out of 4 eligible households do not receive HUD assistance due to lack of funding. The lack of affordable housing in the United States is also due in part to limited housing supply. A land value tax could help address these challenges by encouraging developers to build more housing while also creating revenue for local governments to spend on affordable housing programs.

    Benefits of the Land Value Tax

    Originally suggested by journalist Henry George in the 19th century, a land value tax requires landowners to pay taxes on the value of their land, not including the value of any buildings or structures on the property. While most current property taxes in the United States tax the value of land and the structures built on the land equally, some researchers have suggested that a land value tax could be implemented in a split rate system, which would charge a higher tax rate on land and a lower tax rate on structures. Proponents of this system argue that it is a way to encourage higher density development and generate revenue that could be used to fund affordable housing.

    When a split rate tax is implemented, landowners can offset the burden of higher land taxes by maximizing the use of the land through development. Lowering taxes on structures and raising taxes on land encourages landlords and developers to build in such a way that would result in individuals living on smaller portions of land. In addition, it discourages landowners from keeping land undeveloped or underdeveloped because their tax burden, the ratio between taxes paid and the property’s fair market value, falls as more improvements to the land are made. For example, owners of single family homes might choose to build a duplex or triplex instead because they can increase the value of their property without significantly increasing their tax rate, thus reducing the average tax on the property.

    In addition to incentivizing higher density development, split rate taxes also encourage economic activity in lower valued areas. Land that is close to amenities such as transportation, safe neighborhoods, or job centers is valued higher and experiences higher taxes. Since there is no significant tax penalty for adding structures, developers may have more interest in areas with low property values where they can add housing units or make other improvements without experiencing major tax increases. The split rate tax also shifts the tax burden to areas with higher amenities, returning some of the property value to the local government for use in affordable housing programs or investments in under-resourced parts of the city. 

    Arguments For the Land Value Tax

    Proponents of the split rate tax argue that it stimulates construction and beneficial land uses in lower income areas, helping to address issues of housing supply. Since landowners will be encouraged to increase density and use their land more efficiently, the tax could also help to reduce urban sprawl. Others argue that a land value tax automatically compensates property that is devalued by unwanted development. If land loses value because of new projects, such as nearby train tracks which generate unwanted noise, the property will pay a lower land tax bill. In an op-ed for the Los Angeles Times, three UCLA professors argued that, since housing scarcity creates wealth for homeowners and burdens for those who do not own homes, the government should tax that wealth and use it to lessen the burdens of housing scarcity. They contend that even a small land tax would raise millions of dollars each year that local governments could use to fund affordable housing. For example, a 2% tax on real estate transactions over $1 million in Los Angeles could generate $200 million each year.

    Pennsylvania is one of the states that allows its local governments to implement a split rate tax system

    16 localities in Pennsylvania currently levy a split rate tax, 5 have rescinded split rate taxes, and 12 have considered, but never implemented, a split rate tax. While it is difficult to isolate the impact of land value taxes on development among other economic influences, many Pennsylvania cities experienced development increases and tax cuts for at-risk communities after implementing a split rate system. In the city of Allentown, where the land tax rate is nearly 5 times the building tax rate, the split rate tax was beneficial for at-risk neighborhoods, where more than 90% of homes had their tax liability reduced. It also helped make housing more affordable for many senior residents on fixed incomes by lowering their property taxes. In 2000, local politicians wrote that building permits in Allentown had increased by 32% since the land tax was passed, and the city’s Fairgrounds, an undeveloped parcel of land, experienced a 137% increase in property taxes.

    Before the city of Harrisburg implemented a split rate tax system, it had 4,200 vacant structures, numerous empty lots, and was the second most distressed city in the United States according to the Federal distress criteria. Since levying the tax, the city gained more than $1.2 billion in new investment and the number of vacant structures declined from 4,200 to 500. Today, the city of Harrisburg continues to levy a split rate tax at a land to building ratio of 6:1. Although some researchers argue that the conditions of Harrisburg’s success are hard to replicate elsewhere, including the city’s energetic and motivated mayor, local politicians assert that the land value tax was a key factor in Harrisburg’s ability to combat blight and spur development.

    Land value taxes have also been levied internationally. Australia relies heavily on several variations of a land value tax to fund state and local budgets. New Zealand and South Africa have also successfully implemented land value taxations to support their local governments and redistribute tax burdens. Both domestically and internationally, the land value tax has been beneficial for local governments to make housing more affordable for at-risk communities by lowering their property taxes, increasing high density development, and generating revenue for local budgets.

    Shortcomings and Alternatives

    To effectively stimulate construction of high-density development, a split rate tax would need to be implemented alongside other policies and conditions. If land use regulations and zoning are too restrictive, developers will not be able to increase density and build new structures. Additionally, land value taxes require that assessments of land and improvements be done promptly and accurately. Land can be difficult to value because its price is not directly recognized when a property is sold. In many of the cities where the land value tax was rescinded, researchers argue that the tax became a scapegoat for issues with infrequent and inaccurate assessments and clumsy rate-setting procedures. In order to avoid these problems, local governments would need to adopt the best assessment practices, frequently reassess land values, and change zoning to allow high density development.

    Some argue that a land value tax will not encourage the development or sale of valuable land. Instead, landowners who cannot afford to pay the tax will be forced to sell their land, while wealthy landowners may choose to bear the cost rather than develop their land. This concern was realized in some Pennsylvania cities, where local governments indicated that the land tax was not a large enough burden to stimulate development. If split value taxes are administered at a local level, communities can decide individually what land to building ratio to implement. In areas where undeveloped land is important, such as agricultural communities, the ratio may remain low, while larger cities that seek to incentivize development may implement higher ratios.

    Others argue that land value taxes will more heavily impact individuals who have chosen to invest in land as opposed to those with similar economic means who have invested in stocks and bonds. Further, it disproportionately impacts those who own land at the time the tax is implemented since higher property taxes are offset by lower mortgage payments for those who buy land after the tax is instituted. Some types of landowners, including businesses such as golf courses or land-rich but income-poor residents, may also be hit particularly hard by the land value tax if they rely on undeveloped land for their business or do not have the means to make improvements to their land. In order to tackle these concerns, cities may need to take measures such as phasing in split rate taxes over several years, implementing tax credits for low-income residents, creating exemptions for burdened property owners, or varying tax rates within the locality.

    If implemented with the right conditions and supporting policies in place, land value taxes could be an effective way to encourage a greater supply of high-density housing, generate money for local governments to spend on housing programs, and make housing more affordable for low-income residents. When deciding on this issue, individuals will need to consider if they believe landowners should bear additional tax burdens to support affordable housing. Is it fair for current landowners to pay a tax that will not be as acute for renters and future landowners?  Should industries that depend on undeveloped land be burdened by higher taxes to improve housing supply and affordability? Finally, should the government focus on increasing tax revenue and investing in affordable housing programs, or should the focus be increasing development and lowering taxes for residents?

  • Intro to the European Union

    Intro to the European Union

    Formation History

    As of 2021, there are 27 member states of the European Union. However, the current coalition and its structure has developed gradually throughout the latter half of the 20th century and into the present day. In 1950, French statesman Robert Schuman issued the Schuman Declaration, which called for France and Germany to pool their coal and steel production so that the economic crises that contributed to World War II would not happen again. In 1951, the European Coal & Steel Community was founded by France, Germany, Italy, the Netherlands, Belgium, and Luxembourg. By the late 1950s, this independent economic authority had grown into the European Economic Community and through the Treaty of Rome, a common market of goods, services, and people was established. The United Kingdom and Denmark joined in 1973, followed by Greece in 1981. The Schengen Agreement of 1985 was a pivotal moment for the European Community. It eliminated border controls and passport checks within the Schengen Area, facilitating the free movement of people to travel, work, and live within the area. The European Union was created with the Maastricht Treaty of 1992, and by that time Spain, Portugal and a reunified Germany had joined as well. The European Union has three pillars: the judiciary, legislative, and executive branches. It is the first truly supranational organization in modern history, where countries could be held to a greater independent authority than each of their own. Most recently, the Treaty of Lisbon in 2007 increased centralization, improved regulations and introduced a new global diplomatic framework.

    The 5 Main Institutions of the European Union

    The EU has evolved into a system of government that resembles the United States, and its European relatives. There are 5 main institutions –  the European Council, European Parliament, European Commission, Council of the EU, and the Court of Justice of the EU.

    1. The European Council ensures that the highest elected officials in EU nations are represented in the European Union. It is made up of the heads of state of all EU member countries. They nominate the President of the European Council and the European Commission. This body cannot pass laws. It sets the direction of the EU’s common foreign security agenda and may request legislation to be pursued. The European Council President serves a two and a half year term, once renewable, and presides over four meetings a year in Brussels, known collectively as the EU summits. Decision-making is generally by consensus and only heads of state can vote. Additionally, the European Council participates in the Euro Summit, where the heads of state of the Eurozone, the Council President and the Commission President meet exclusively to discuss economic policy in the Euro Area.
    1. The European Parliament is the law-making body of the EU. It could be described as the body of the European citizens, with direct elections held every five years. The Parliament formally elects the Commission President and approves the Commission body, and has the power to form investigative sessions . They also undertake election observations, sending delegations to countries outside the EU, to analyze their election process and ensure democratic principles are upheld. The Parliament establishes the EU budget with the European Council and sets monetary policy with the European Central Bank.
    1. The European Commission is responsible for drafting proposals for legislation for the European Parliament. It represents the interests of the European Union as a whole, implementing its global vision for EU development and funding programs. It proposes and manages the EU budget, which is submitted to the Council of Europe and then Parliament for approval and final ratification. The Commission works with member states to execute funding projects, and acts in a supervisory and regulatory capacity. While the Commission President and commissioners are chosen by the European Council, the European Commission is intended to act as its own independent authority that does not follow a single state’s agenda. The Commission President defines the policy direction, and with the Commissioners produces an annual work programme that outlines the EU’s strategic objectives and how they are to be implemented. In its own words, the European Commission sets objectives that support and promote European values of “freedom, democracy, equality, the rule of law, and respect for human rights.”
    1. The Council of the EU, also known as The Council, works closely with the other branches to finalize the agenda of the European Union. They are the ‘decision-maker’ of the EU. The Council will negotiate and adopt EU laws from European Commission proposals. They are responsible for developing EU foreign and security policy with European Council guidelines, as well as adopting the annual EU budget with the European Parliament. The Council meets with other nations and international organizations to finalize agreements between them and the EU. There are no fixed members and the President serves a six month term that rotates between nations. There are ten different policy areas on which the Council meets, and each member state will send their respective minister for that configuration. For example, if the meeting is on foreign affairs, then 27 foreign ministers will attend. The decision-making process is a qualified majority system with four countries needed for a veto. For ‘sensitive topics’ such as foreign policy and taxation, a unanimous vote is necessary.
    1. As an intergovernmental organization, each nation interprets the EU’s laws in accordance with its own constitution. The Court of Justice of the EU or CJEU is responsible for making sure that EU laws are applied to member states in the same way. It is the judicial branch of the EU. It settles legal disputes between nations and EU institutions. For instance, if the European Commission or a different nation feels that a member state is failing to comply with EU law, then it is up to the courts to rule whether an infringement has occurred. On the other hand, if a member state or any institution believes that an EU act violates EU treaties or the sovereignty of the national court, it can ask the CJEU to annul the legislation. There are two courts of the CJEU, the Court of Justice and the General Court. The Court of Justice is the Supreme Court of the EU, and deals with requests for preliminary rulings from national courts seeking guidance on how to interpret EU law. The General Court is responsible for contestations to EU institution actions against its member states that violate their fundamental rights or EU treaties. It deals mainly with competition law, state aid, trade, agriculture and anti-terrorist law. First, a written statement for annulment of an EU law is submitted to the Court. A general meeting, usually with five judges, then takes place to discuss if a hearing should be held and if the advocate general is necessary. The advocate general issues official opinions on the case to the judges after the lawyers of either side present their case. Their statements are not legally binding, but greatly influence whether an action for annulment will be successful. It is General Court procedure to have most cases heard by three judges. Any EU citizen, private company, or international organization can submit a case to the CJEU.

    Current Issues Facing the EU

    Since 2015, the European Migrant Crisis has been one of the longstanding humanitarian issues for the EU, but since then there have been greater measures taken to ensure a humane migration policy. It remains a very significant global issue, and for detailed analysis read Siena Frost’s article here.

    The United Kingdom, the second largest net contributor to the EU, officially left the European Union in 2020 as a result of the controversial Brexit referendum vote in 2016. This will have wide reaching economic impacts on the United Kingdom and the European Union, and the ongoing negotiations demonstrate the intricate ties that the EU has within countries. 

    With the introduction of the Euro, came the most impactful economic mechanism of the European Union. For a breakdown of the Euro, the EU’s common currency, and its issues, read Francesca Reynolds’ article here.
    With a 2 trillion-plus stimulus package, the EU’s largest long-term budget to date will include a 750 billion euros COVID-19 recovery fund for a post-pandemic Europe. Another significant financial injection is the European Green Deal, with one third of the 1.8 trillion recovery plan going to financing its investments in building a more environmentally sustainable Europe.

  • US, China and the Quadrilateral Security Dialogue Part 1: Formation

    US, China and the Quadrilateral Security Dialogue Part 1: Formation

    The Quadrilateral Security Dialogue (also known as the Quad) is an informal alliance between the United States, India, Japan, and Australia. It was created in 2004 in response to the Indian Ocean tsunami, and US, Indian, Japanese, and Australian vessels worked together to provide humanitarian relief. Beyond these initial relief activities, the four nations decided to further cooperation to promote an “arc of freedom and prosperity” in the Indo-Pacific region. Aside from maritime security, the Quad serves other major purposes: observing and predicting Chinese actions and intentions, responding to those actions, and furthering the economic interests of participating countries by creating new global supply chains away from China. China views the Quad as an attempt to check its power in the Indo-Pacific arena.

    Dissolution and Eventual Reunion

    The first attempt at the alliance did not last long. Member states were concerned that the Quad would damage their cooperation with China, so the alliance dissolved later in 2004. However, by 2017 the four countries felt that concerns over China’s growing assertiveness outweighed the potential harms of damaging the relationship. China pivoted to a more active economic and military role on the global stage in 2012 when President Xi Jinping assumed power. This can be seen from the territorial dispute in the South China Sea and the Belt and Road Initiative. 

    Relationship with the Quad

    Relations between China and the Quad member states have declined in recent months. Australia led investigations into the origin of the COVID-19 pandemic, leading to Chinese sanctions on Australian commodities. The dispute with Japan over the South China Sea has escalated, and China has sent military ships and aircrafts into the disputed waters with increased regularity. Tensions along the India-China border led to a deadly confrontation between troops of the two nations in the summer of 2020.

    Recent DevelopmentsIn March 2021, the four nations convened in the Quad’s first summit and released a joint statement, “The Spirit of the Quad.” In this statement, they reaffirmed their commitment to the organization, sharing a vision for a “region that is free, open, inclusive, healthy, anchored by democratic values, and unconstrained by coercion.” In addition, the four nations pledged to work together to address global challenges, including climate change, cyber space, disaster relief, humanitarian assistance, quality infrastructure development, critical technologies, maritime domains, and counterterrorism. They have also pledged to deal with the impacts of COVID-19—in particular, their focus now lies in providing equitable vaccine access to the Indo-Pacific region.