In March 2021, the California Housing Partnership and Housing California released a ten-year project to address the housing crisis in the state. The mission of “Roadmap Home 2030” is to provide affordable housing for low-income households and the homeless population in California. Housing as a human right is the foundation of the Roadmap’s framework and backed with equity and evidence-based solutions. The project also aims to minimize racial disparities in homeownership, homelessness, and housing insecurity. In order to achieve these goals, the Roadmap outlines a four-step approach that highlight the most important aspects of the housing crisis:
The biggest barriers for creating affordable housing nationally are the increasing demand and the insurmountable price for development. These push and pull factors of the free-market have caused 40 million Americans to spend more than 30% of their incomes on housing while homeownership decreases and rental prices increase. At the national level, the Roadmap Home project would require immense funding and support in order to meet the demands for housing. Federal and state funding are allocated based on need, determined by the local housing authority and its tracking of the homeless population throughout the year, homes facing eviction or foreclosure, households that are severely cost-burdened, and other populations in need of affordable housing. In California, the Department of Housing and Community Development and the Department of Social Services administer these funds across the state. Focusing on localized needs allows for efficient and effective use of funding.
Public-Private Partnerships (PPPs) also provide a similar incentive for developers when local municipalities recruit private companies to build affordable housing. PPPs are contracts between public partners (government entities) and private partners that outlines responsibilities and financial mechanisms for both parties in a long-term project. Local municipalities can defer taxes and offer assets like land, buildings, and entitled parcels to assist with maintaining equal benefits for developers and low-income households. The public partner incentivizes the private partner at a price point that allows low-income households to occupy the units and still produce profit. PPPs allow for public entities to conduct important social or economic projects with capital and competency from for-profit developers. It is vital for contracts to outline potential risk factors and social or environmental forces that could impact said project due to their long-term characteristics. This generation of capital for affordable housing is vital for the extended Roadmap Home project and municipalities with high homeless and low-income populations should prioritize the partnerships where federal or state funding is not available.
Meeting Demand
Beyond funding, the immense demand for housing among low-income and moderate-income households creates another barrier to this project. To create affordable and safe housing, federal and state entities need to look towards more sustainable options. Land and zoning create another obstacle for developers by limiting where affordable units can be constructed. To combat this, state-aided programs should focus on acquiring motels and hotels for rehabilitation into affordable housing units. Rehabilitation is significantly cheaper than developing new units from scratch and these buildings are already zoned for a multi-family dwelling. The Roadmap Home 2030 report estimates that a new unit costs $172,000 to construct, whereas acquiring and rehabilitating old hotels and motels costs $59,000 per unit. This model allows for quicker and more efficient provision of affordable units. Funding options for developers should be centralized in each state to streamline the application process and make this project more efficient. Many states have disjointed funding channels for affordable housing, forcing developers to submit applications to multiple different sources, increasing the cost of affordable housing through the tedious burden to acquire funding.
The Opposition
Another obstacle that cannot be ignored is the strong opposition to affordable housing and social services as a whole. Many oppose increasing the social safety net and government intervention. Also, creating a national project for affordable housing centralizes the housing sector in the social safety net, another reason that many voters would be less inclined to support an expanded Roadmap Home.
Outside of politics, there are significant social stigmas associated with affordable and public housing. The presence of “Not in My Backyard” (NIMBY) has spread throughout neighborhoods in response to affordable housing projects, homeless shelters, and other social services. “NIMBYism” is characterized by residents in a specific neighborhood that oppose affordable housing projects being built in their “backyard” and make conscious efforts to dissuade the developers. Instead of looking at the broader problem of homelessness and housing insecurity, residents see the influx of low-income residents to threaten property values, safety, and aesthetics of the neighborhood.
Key Takeaways
For the last fifty years, the U.S. has tried to address the affordable housing crisis to no avail. Now, while still experiencing the economic and social impact of the COVID-19 pandemic, it is more important than ever for vulnerable populations to have shelter. The biggest component of this policy is the emphasis on housing as a human right and using equity-based methods to house everyone. The United States is too large and decentralized for the federal government to fund and construct affordable housing. Instead, the federal government and local authorities need to strengthen communication in order to streamline funding in an efficient way, allotted based on regional need. The LIHTC is already the most important policy for affordable housing development so increasing the number of credits allotted will benefit increased housing development. Similarly, the rehabilitation of old buildings is already a successful project in many areas, with places such as Denver that implemented a 139 micro-apartment complex in a former Quality Inn and Suites for low-income and houseless people. These are affordable and achievable housing goals that this country can achieve, but first, housing needs to be understood as a necessity for everyone, regardless of socioeconomic status.
Reflection Questions
Does everyone deserve to be housed?
Do federal and state authorities have a responsibility to provide affordable housing for everyone?
Do you see disparities in housing where you live?
What other approaches could solve the housing crisis besides direct action for funding and development?
Introduction to Free Trade and Comparative Advantage
Because of the economic principle of comparative advantage, free trade between countries is typically beneficial for all parties involved. One nation has a comparative advantage over another if it is able to carry out economic activity in a specific field at a lower opportunity cost in comparison to another country. For example, if country A can produce either 100 loaves of bread or 400 t-shirts in an hour, while country B can produce either 200 loaves of bread or 300 t-shirts in an hour, country B has a comparative advantage in the production of bread while country A has a comparative advantage in the production of t-shirts. In this scenario, and oftentimes in the real world, trade between country A and country B is mutually beneficial as country B can specialize in the production of bread, country A can specialize in the production of t-shirts, and they can each trade the good they produce for the other good that they do not.
Methods for Industry Protection
Sometimes free trade runs counter to a nation’s economic or political goals, like when an industry in one country is out-competed by an industry abroad. In these instances, the home country of the struggling industry may take a variety of actions to try to maintain their stake in the industry, such as:
Applying a tariff, a common trade restriction. Tariffs are taxes that are placed on certain imports on a product from another country, which typically increase the price of the good in markets in the importing country, encouraging consumers to buy products domestically rather than abroad.
Applying a quota, or placing a restriction on the quantity of goods that are imported. This limits the supply of the good and can increase the cost of making the product within the exporting country.
Providing home industries with subsidies, or monetary assistance. Rather than taking action against another country’s goods, the importing country can assist their industries by using government money to cover a portion of the cost of production. Subsidies can decrease the cost of supplies for the production of goods and thus allow the struggling industries to sell their goods at a lower price and still remain profitable.
Trade Agreements
Leaning too heavily on these protectionist measures can often escalate to countries using increasingly harsh trade restrictions, crippling foreign economies and decreasing economic efficiency. In order to avoid this outcome, countries will often establish trade agreements which outline rules of international trade that all members can agree upon and allow for fair competition. Established by the United Nations in 1947, the General Agreement on Tariffs and Trade (GATT) is an example of such an agreement. To resolve internal issues regarding dispute resolution, the GATT was replaced by a trade governing body known as the World Trade Organization (WTO) in 1995. The formal organization structure of the WTO and its amended rules were largely viewed as an improvement over the GATT. Currently the WTO consists of 164 member states, including the United States, meaning that it governs the vast majority of international trade.
The United States is also involved in numerous trade agreements with specific countries. The US establishes many Free Trade Agreements (FTAs) or Trade Promotion Agreements (TPAs) which allow for the free flow of trade between nations with minimal restrictions. In many of these agreements the US maintains a significant trade surplus, meaning that the US exports more to the other nation than it imports from them. Even in trade agreements where the US has a trade deficit, importing more than it exports, the US still gains valuable commodities and foreign investment in the economy. For example, in the US-South Korea FTA, the US has a trade deficit of $7.6 billion, but the volume of trade is valuable. The US exports $56.5 billion worth of goods while importing $77.5 billion. This trade agreement also creates about 358,000 jobs in the US economy. It is important to remember in these examples that trade is not a “zero-sum” game where the more you export the better. Imports can provide lower prices for consumers, greater variety, and an influx of materials necessary for the production of other goods.
Another type of trade agreement the US establishes with other countries are Trade and Investment Framework Agreements (TIFAs). These agreements outline the framework for future discussions on trade and investment between the two countries. These agreements allow for annual council meetings between the countries involved to negotiate on a wide range of trade issues without the agreement setting any explicit trade rules. The US also partakes in many Bilateral Investment Treaties (BITs) with countries where investor rights are not already protected through other trade agreements. These treaties are designed to encourage the countries involved to adopt free-market policies that allow for more open investment by private companies.
BITs require that those who sign onto the agreement:
Treat US investments as favorably as domestic investments.
Have clear limits on foreign governments claiming investments (including repayment for any investments that are seized)
Don’t use performance requirements for operating an investment
Allow investors to work with the top managerial personnel of their choice when negotiating an investment.
Most importantly, BITs allow for investors of either party to advocate for their rights by submitting an investment dispute with the government of the other party to be settled by an international court.
NAFTA and US Trade
One of the most important US trade agreements in the last decades has been the North American Free Trade Agreement (NAFTA). NAFTA facilitated a large increase in goods trade between the US, Canada, and Mexico. In NAFTA’s first ten years, trade in goods increased from $293 billion in 1993 to $627 billion in 2003. By 2016, this value had increased to nearly $800 billion. Created in 1994, NAFTA was the world’s largest free trade agreement until it was replaced in March of 2020. Due to the Trump administration perceiving a disadvantage in America’s production of different industries relative to Mexico and Canada, namely in agriculture and automobile production, the United States-Mexico-Canada Agreement (USMCA) was established. Most concerning to the Trump Administration were trade deficits of $101 billion to Mexico and $27 billion to Canada as of 2019. The USMCA introduced several rule changes to automobile manufacturing, labor standards, the Canadian dairy and wine market, intellectual property, pharmaceuticals, and dispute resolution. This agreement went into effect on July 1, 2020. As of June 2021, the US trade deficit with Mexico has decreased to $52.9 billion and the trade deficit with Canada has decreased to $19.4 billion.
Health literacy is an individual’s ability to find, understand, and use information and services in order to make well-informed health-related decisions for themselves or others. Only about 12% of Americans are considered health literate. When health organizations provide patients health information that is difficult for the patient to understand, or has unfamiliar and confusing steps, we create a health literacy problem. Low health literacy is common among Americans who have limited education, are older, have lower socio-economic statuses, are non-native English speakers, and those with chronic medical conditions. Misinformation, which is false or inaccurate information that can deceive or misinform others, can create confusion, fear, and anxiety among those with low health literacy. It can even impact those who have high health literacy and their ability to understand medical information. Misinformation has arguably spread just as fast, or faster, than COVID-19 itself.
Health Literacy’s Importance During a Pandemic
Having a high rate of health literacy can help prevent the onset of illness and disease, reduce national disease averages, and improve population health. A current and persistent threat to global health is the COVID-19 virus, which has caused mass casualties and long-lasting negative health outcomes to the affected global population. There are currently 11 variants of COVID-19, with the Delta variant being of particular interest. Due to an increase in strains and total cases, a rapid transmission of accurate and reliable health information is crucial in preventing the virus from spreading further. Patients who don’t have access to accurate and reliable health information have higher hospitalization rates and develop more chronic diseases, on average. Similarly, Pfizer states that low health literacy is associated with many adverse health outcomes, such as:
Lower reported health status
Greater mortality rates
Less-specific disease knowledge and ability to recognize common signs and symptoms of illness.
Greater utilization of hospital services, and less confidence and skills needed for self-care and chronic disease management.
The Lancet notes that health literacy also involves taking social responsibility, as thinking beyond personal choices and self-interest can make an impact on reducing the rapid transmission of COVID-19 and increase vaccination rates. Health literacy provides the tools needed to prevent and combat these negative health outcomes, and allows patients to make educated decisions about their health.
Impact on Vaccine Development
The current goal is to get 75% of the world population vaccinated with one of the approved vaccines available; Pfizer-BioNTech, Moderna, and Johnson and Johnson/Janssen. Achieving this goal of 75% would mean that herd immunity could take effect, where enough people are protected from COVID-19 to effectively control its spread, thus reducing associated transmission and mortality rates. Currently, about 46.8% of the world has received at least one dose of the three vaccines listed. As of late September of 2021, Africa had the lowest vaccination rate, and Europe had the highest, with North America following closely behind. 79% of shots administered are in high or upper-middle-income countries, and 0.5% of doses were administered in low income countries. Low health literacy and misinformation have targeted individuals through social media, news outlets, word of mouth, etc. Some common misconceptions include:
The COVID-19 vaccine contains a microchip.
The vaccine can make an individual magnetic.
The vaccine can make an individual ‘shed’ vaccine components outside of the body.
The vaccine alters a human body’s DNA.
The vaccine alters a woman’s fertility.
The CDC notes that most of the misinformation and disinformation has been centered around vaccine development, safety and effectiveness, and COVID-19 denialism. In addition, the WHO calls the spread of misleading COVID-19 and vaccine information an infodemic, that furthers, “skepticism and distrust, which is the perfect environment for fear, anxiety, finger-pointing, stigma, violent aggression and dismissal of proven public health measures – which can lead to loss of life.” This scepticism and distrust has cost the United States over $5 billion from June-August of 2021 from preventable COVID-19 hospitalizations, and caused over 280,000 preventable cases among the unvaccinated during the same time period. Since the onset of the virus, nearly 4.8 million have lost their lives worldwide.
How to Monitor Misinformation
In order to make well-informed decisions about one’s health, access to reliable and factual health information is essential. Monitoring misinformation and disinformation during a global pandemic can be challenging, but there are strategies available to assist with this goal. The International Federation of Library Associations and Institutions (IFLA) recommends these 8 strategies to help spot misinformation:
Consider the source: identify the author (if possible) and investigate other publications the author has made. Is the author relevant and trustworthy?
Read beyond the story or publication, or compare other articles to it in order to increase validity.
Make sure the supporting sources are credible, and support the publication.
Identify if others agree: is it peer-reviewed, or trustworthy among others?
Try to identify if it is a joke/satire.
Check your biases, and consider your own beliefs as they could affect judgement.
Ask the experts: consult credible, trustworthy sources like the WHO, CDC, etc.
Read the article or story before you click share.
If one comes across a source that is spreading false information, there are ways to report it here, which provides instructions to report misinformation/disinformation among various social media outlets, like Facebook, Instagram, Twitter, YouTube, TikTok, etc.
As discussed in the US-China Trade Deficit paper, the United States and China have a complicated economic relationship. While the two nations compete in many industries, they are also major consumers of each others’ goods and contribute on different points in a supply chain to produce many of the products in demand across the globe. At the same time, the trade deficit with China has caused growing concern in the United States, and caused many economists and policymakers to explore ways to better support US business in the face of competition with China.
I. Import Tariffs
An import tariff is a tax levied by one country on the goods and services imported from another country. Typically, governments impose these tariffs to protect domestic industries, gain additional revenue, and, in the case of the U.S.-China trade war, retaliate against unfair trading practices. Beginning in 2017, the United States imposed a litany of tariffs on Chinese imports, motivated by the expanding trade deficit. In theory, increasing the price of Chinese imports would drive up demand for domestically-produced goods and services, and, if the output increased to meet demands, would prompt domestic producers to hire additional workers. The import tariffs placed on Chinese goods and services would narrow the widening trade deficit and stimulate economic growth. However, many economists argue that the Trump administration’s import tariffs, when put into practice, achieved the complete opposite effect.
A recent report released by the U.S.-China Business Council (USBC) asserts that, contrary to the Trump administration’s goals, the tariffs actually “raised consumer prices on both imported products and domestic products.” The report also claims that by reducing consumer spending and stifling economic growth, these trade policies have cost the United States approximately 245,000 jobs. The Biden administration has since left these tariffs intact, a decision which Wall Street Journal columnist Henry Olsen deemed “welcome”. Olsen argued that to keep China from “[mounting] a serious challenge to U.S. global dominance,” the Trump administration’s burdensome tariffs must remain a necessary evil.
II. Import Quotas
Import quotas, a close cousin of import tariffs, achieve a similar objective through a different process. Historically, both have been utilized to reduce the volume of imports and encourage demand for domestically-produced goods. However, import tariffs are taxes on imported goods, whereas import quotas are limits on their quantity or monetary value. By many accounts, quotas are more effective in restricting trade since they aren’t affected by fluctuations in demand or exchange rates, but this isn’t a universally useful strategy. As Monica Sanders from the Houston Chronicle asserts, trading partners typically respond with similar trade restrictions, resulting in “less exporting opportunity for all producers and higher prices for all consumers.” For example, during the early 1980s, the United States imposed import quotas on Japanese automobiles to generate growth within the domestic auto industry. As economist Edward Hudgins remarks, by limiting the number of imported automobiles, domestic auto companies raised prices “without fear of losing business to less expensive competitors.”
III. Import Subsidies
Subsidies are government funds paid to domestic producers. Resembling other protectionist policies, subsidies protect against inexpensive foreign imports by decreasing production costs and, consequently, increasing production growth. This leads to increased demand for domestically-produced goods. While they do regulate costs and prevent the long-term decline of domestic industries, subsidies also lead to consumers bearing the brunt of the financial burden and can be complicated for infant industries. In order to collect funds for subsidizing domestic industries, governments must impose higher taxes. Since they develop without competition, subsidizing infant industries may eventually lead to those industries requiring permanent subsidies to stay afloat. Despite these potential risks, subsidies have remained a central component of U.S. trade policy over the last several decades. To encourage domestic energy production, the United States provides a number of subsidies to the fossil fuel industry. Totaling approximately $20 billion per year, these subsidies were initially intended to “lower the cost of fuel production and incentivize new domestic energy sources.” Due to comparatively cheaper renewable energy sources and negative environmental externalities, taxpayers have found it difficult to rationalize this government spending.
Over the last three Presidential Administrations, the Bears Ears National Monument has become the center of a heated debate. With some fighting for size reductions and others calling for full size restorations, both sides have presented a variety of compelling arguments. You can read more about the Bears Ears controversy here.
Although there are many different arguments surrounding Bears Ears, the economic impact of the monument is one of its most hotly contested issues. Some say that the monument’s designation would support local economies through increased tourism revenue, while others argue that the monument would be largely harmful to the surrounding communities because of limitations on resource extraction and job creation.
Economic Trends of National Monuments
The United States is home to over 100 national monuments. With designations occurring as early as 1906, the long history of national monuments allows researchers to observe trends in their economic impacts.
A 2020 study found that national monuments usually result in positive economic impacts. The research spanned 25 years and examined links between national monument designation and economic impact throughout the western United States. Although average wages saw no change from monument designations, data collected during the study indicated that monuments generally lead to increased numbers of businesses and jobs in the surrounding areas. Furthermore, it was discovered that these new businesses succeeded more frequently and held relatively more staying power.
Researchers have observed many examples of national monuments supporting local and state economies. On a state level, Nevada’s outdoor recreation industry sustains almost 90,000 jobs and generates over $12 billion in yearly consumer spending. In Maine, $2.2 billion in wages and over 75,000 jobs stem from outdoor recreation. In New Mexico, the outdoor recreation industry creates thousands more jobs than mining and energy combined. For local economies, the number of service jobs within the Giant Sequoia National Monument region increased by 35%. Arizona’s Vermillion Cliffs National Monument increased the neighboring county’s per capita income by 24%, grew the population by 18%, and increased jobs by 25%. The San Gabriel Mountains Monument increased average incomes in the region by $1,099 each year.
However, the economic issue is not clear-cut. A Headwaters Economics review of the Grand Staircase-Escalante National Monument reported increases in population, jobs, personal income, and per capita income from the years 2001-2015. However, some locals claim that the economic boost from resource extraction industries would easily surpass any benefits brought in from tourism. They argue that the tourism industry is largely seasonal and lower-paying, but resource extraction industries provide stable, higher-paying jobs at all times of the year.
Economic Impact of the Bears Ears National Monument
The Bears Ears National Monument is located in San Juan County, Utah. After its national monument designation in 2016, then-Utah Governor Gary Herbert expressed disappointment and concern due to its potentially harmful effects on local economies. Herbert, along with other Republicans, supported a resolution claiming that the Bears Ears Monument would “forever remove the possibility of economic development and decimate the economy of the region.” The resolution further claims that the monument’s resulting tourism increase will not be enough to sustain its local communities.
Despite fears of harmful economic repercussions, Bears Ears generally helped grow local businesses since its designation. One example comes from Persephone Black, a San Juan County resident and small business owner, who saw her income increase after Bears Ears’ monument designation. A member of the Navajo tribe, she sells traditional jewelry made from glass beads and juniper seeds. She, along with other indigenous business owners in the region, benefited from increased rates of tourism, as visitors often spend money by purchasing souvenirs, food, recreation services, and more. Specifically, those interested in cultural tourism support local indigenous businesses by attracting visitors who wish to engage with the unique cultural heritage of the Bears Ears region.
Those in favor of restoring the Bears Ears monument to its original size also explain that tourism will be better for the economy in the long-run, as visitors will bring in a comparatively sustainable stream of income. Contrasted with the “boom and bust” cycles commonly observed in resource extraction industries (i.e. oil, gas, uranium mining industries), tourism in Bears Ears can be maintained over a longer period of time with less harm to the natural environment.
By protecting the natural environment of Bears Ears, surrounding communities can experience even more economic benefits outside of outdoor recreation. A 2017 assessment of Bears Ears’ natural value concluded that the monument provides over $1 billion in ecosystem goods and services every year. Ecosystem health ultimately benefits humans through goods such as water, timber, and wildlife, and through services such as aesthetic value, water filtration, and flood protection. Therefore, many environmentalists argue that damages to the environment through natural resource extraction would prevent humans from receiving these free rewards, and ultimately cause more economic harm than good in the long-run.
Conclusion
While the economic consequences of the Bears Ears National Monument are important to take into account, they are not the only factors to consider. The debate surrounding Bears Ears is complex, with both sides presenting a variety of logical arguments. As a voter, it is up to you to decide which factors you value most, and ensure your voice is heard.
Here are a few ways to engage with the Bears Ears Monument controversy:
Elected officials want to hear from their constituents. Because constituents’ thoughts and perspectives are often taken into account, contacting one’s representatives allows voters to enact real change.
The creation of the Treaty on the Non-Proliferation of Nuclear Weapons (NPT) in 1968 marked the first major shift towards nuclear disarmament that occurred on a global scale. The NPT is a landmark international treaty aimed at preventing the spread of nuclear weapons and weapons technology and achieving international disarmament. The treaty itself has culminated in a “grand bargain” between nuclear powers and non-nuclear powers to ensure that no new nuclear weapons can be acquired, that nuclear energy use remains peaceful, and that nuclear materials stay secure. The creation and enforcement of the NPT by the United Nations prompted talks between the United States and Russia to create mutual arms control agreements and reduce nuclear stockpiles. Beginning in November of 1969 with the presentation of SALT I, which limited each countries’ strategic missile defenses, the two nations went on to engage in more than half a dozen other nuclear-focused disarmament treaties with one another.
The New START Treaty between Russia and the United States was renewed in 2021. The renewal was significant because it assured both countries’ continued commitment to regulating and limiting nuclear weapons and weapons technology, and because of the upcoming review of the NPT that occurred later this year. However, there is a growing concern that existing agreements, including the Intermediate-Range Nuclear Forces (INF) Treaty, are unraveling. Experts hope that because of the transparency in U.S.-Russian strategic relations that New START has provided, the rest of the world will follow suit and the NPT review conference will be a space to promote stability and strengthen commitments by signatories of the NPT. The New START treaty, which was signed in 2010, by the U.S. and Russia, legally binds each state to limit their strategic nuclear warheads to 1,550 on 700 strategic delivery systems, and limits each side to 800 deployed and non-deployed launchers. This limit is 30% lower than the previously allowed 2,200 nuclear warhead amount agreed upon in the 2002 SORT Treaty and 50% lower than the 1,600 vehicle delivery limit established under the 1991 START 1 agreement. In addition to major limits on each country’s physical nuclear stockpiles, the treaty also commits each state to mandatory on-site inspections of nuclear storage and production facilities, data exchanges, and notifications related to strategic offensive arms and facilities covered by this treaty.
New START gives the U.S invaluable national security information by providing insights on the Russian nuclear arsenal, and maintains the international standard for nuclear non-proliferation by the world’s two largest nuclear powers. In a larger sense, the treaty creates a stable base on which to uphold the major international arms control treaties such as the NPT, Treaty on The Prohibition of Nuclear Weapons (TPNW), and The Comprehensive Test Ban Treaty (CTBT). The renewal of New START by the U.S. and Russia is particularly important for the continued support and upholding of the NPT because although its global support is strong, statements by members of civil society confirm that its long-term viability needs to be continually addressed.
Nicaragua’s relationship with the United States began in 1824, when it declared independence from Spain and subsequently joined the Federation of Central American States. The United States, under the leadership of James D. Monroe, recognized the independence of the Federation of Central American States, which at the time included Guatemala, Honduras, Costa Rica, and El Salvador. It was not until 1849 that the United States recognized the independence of Nicaragua, when then-president James K. Polk held a meeting with the Charge d’Affaires Eduardo Carcache.
The fall of the Sandinista regime and the beginning of the Chamorro government marked a new era of relations with the United States. The Chamorro government reversed many of the previous regime’s policies and undertook a series of reforms throughout the 1990s. Key policy changes included the reducing the size of the army and the resignation of General Humberto Ortega (chief military officer during the Sandinista regime). These changes signified greater civilian control over the military. However, unrest still defined the administration as disgruntled former Contras (renamed the Recontras) continued to promote unrest because they felt the Sandinista-dominated military was violent towards other political groups, and the administration failed to follow through on its promise of redistributing the land. The Chamorro government managed to disarm most of the Recontras by 1995. When it was time for the election of a new administration in 1996, the Chamorro government promised peaceful elections to transition from one civilian government to another.
In April 2018, the government social security program increased worker contributions but decreased benefits, and this served as a catalyst for widespread protests and riots. Anger focused on the Ortega regime, and protests spread across many major cities. These protests were often met with violence. Soon after, Ortega withdrew the social security reform, though the violence towards citizens caused continued protests. The death toll reached nearly 300. By January 2020, nearly 88,000 Nicaraguans had fled the country in response to the unrest. The Inter-American Commission on Human Rights and the United Nations’ human rights spokesmen accused the police and authorities of extrajudicial killings, torture, arbitrary detention, and the denial of the right of freedom and expression.
Relations between the United States and Nicaragua remain rocky. The future of Nicaraguan elections, democratic processes, and civil rights remain in question.
Nicaragua has been grappling with the high risk of human trafficking within its borders. Human trafficking recruiters often use social media outlets within the country to recruit vulnerable populations of women and children. Traffickers within Nicaragua recruit individuals through social media, promising high-paying jobs outside of the country, in reality forcing them into labor. Children are targeted through the same initiatives and are forced into illegal drug trafficking and production. Nicaragua serves as a transshipment point for cocaine and arms-for-drugs shipments into the United States.
Environmental justice is both a field of study and a powerful social movement that is concerned with the unequal distribution of environmental benefits (e.g. clean water, parks, healthy food, etc.) and costs (e.g. unsafe housing, air pollution, soil pollution, etc.) between different social groups. Environmental justice is an intersectional concept that includes both environmental conservation and social justice elements, as issues that impact the environment have disproportionate impacts on certain people who live there. Environmental justice aims to ensure that everyone, regardless of socioeconomic status, has the same degree of environmental protection and equal access to the processes that directly impact the communities they live in. Although the concept of environmental justice emerged as recently as the early 1980’s, it has since gained significant political attention. Its goals have been incorporated into national, state, and local policies across the country.
The history of environmental justice within the United States predates the country’s initial founding and begins with the earliest European settlements of the 15th century. European colonization forced indigenous groups away from their traditional lands and ignored the methods they used to manage land sustainably. Throughout the years, environmental injustices continued to take on various forms as the country evolved. For example, larger populations created a need for increased city planning, and urban developers placed most waste incinerators in predominantly low-income and minority communities. Today, environmental injustices are observable in a wide variety of circumstances, ranging from food deserts, to water pollution, to flooding vulnerability. Our understanding of environmental injustices has evolved especially quickly over the last few decades, as the reality of climate change and its repercussions are more widely recognized by both the public and policymakers. For instance, as natural disasters exacerbated by climate change threaten the nation’s wellbeing, we find that those unable to evacuate, adequately prepare, and recover are already-vulnerable communities.
Elected officials across the United States have made attempts to address and combat environmental injustice on all levels of government. Local attempts have been made through municipal bans on certain activities, strengthened environmental review processes, enforced public health codes, and many other methods. While not every state has embraced environmental justice goals, many states such as California, Virginia, Massachusetts, New Jersey, and several others have committed to environmental equity by creating Offices for Environmental Justice, prioritizing environmental justice through legislation, enforcing environmental justice-focused programs, and more. Federal responses to environmental injustices have varied dramatically over the last few administrations, with some being less favorable to environmental justice advocates than others. However, with a new administration now in place, many are hopeful that current President Joe Biden will live up to the promises he has made to reduce the environmental burden faced by marginalized communities across the nation.
Marginalized Communities and Environmental Justice
Marginalized communities are communities that face discrimination and exclusion in various forms based on their identities. The norms and processes affecting marginalized groups put them at a severe social, cultural, economic, and political disadvantage. Marginalized communities typically include racial/cultural/religious minorities, low-income and homeless individuals, immigrants, disabled individuals, refugees, and more. Some examples of exclusion and discrimination faced by such groups include, but are not limited to, disenfranchisement, unequal representation in politics, unequal pay, and harassment.
Environmental justice is an immensely important topic, as marginalized communities often face significantly worse environmental conditions than those who are of a higher socioeconomic status. Because marginalized communities have fewer resources, less time, and less political power to resist unequal environmental conditions, they will continue to have less of an influence over the environmental policies that affect them most. Marginalized communities experiencing environmental inequities are often referred to as environmental justice communities.
Examples of Environmental Injustices
Environmental injustices can be observed in a number of situations. These examples have changed over time as the United States has grown and modernized. During European colonization of the Americas, examples of environmental injustices included indigenous exclusion and displacement from ancestral lands. Today, examples of modern environmental injustices have expanded to include a large variety of concerns, and the list continues to grow as climate change poses new and worsening challenges. The following list describes 10 ongoing environmental justice concerns within the United States and its territories, but this list is not exhaustive.
Water pollution and access: Drinking water violations are issued when a water system does not meet the Environmental Protection Agency’s (EPA) healthy drinking water standard. Polluted drinking water can arise from a wide variety of sources, such as corroded pipes or industrial discharge. A 2019 study of drinking water violations across the United States confirmed that the rate of such violations is higher in communities with more low-income individuals, racial minorities, and non-native English speakers. Increased drinking water violations were also observed in areas with less reliable access to transportation and more crowded living conditions. Furthermore, these communities experience slow and poor enforcement of laws ensuring clean water access, meaning that these communities face unsafe drinking water conditions more frequently, and for longer. The health implications from contaminant exposure can range from gastroenteritis, to decreased immune system functioning, to cancer.
Air pollution: Marginalized communities are more likely to live near highways, industrial plants, waste incinerators, and other significant sources of air pollution. Studies show that approximately 79% of solid waste incinerators within urban areas are located in marginalized communities. The EPA also classifies air pollution as an environmental justice concern due to the fact that marginalized communities are disproportionately impacted by hazardous air quality, and are at a higher risk of developing health issues such as asthma, cardiovascular disease, and reduced lung function.
Soil pollution:Contaminated sites are areas of land that contain hazardous waste and/or other substances that could potentially harm property, people, or animals. Because those living within a close proximity to such areas tend to be ethnic minorities and lower-class individuals, this raises environmental injustice concerns. Living near contaminated sites puts individuals at a higher risk of developing cancer, experiencing developmental disabilities, birthing children with congenital defects, and more.
Food deserts: Food deserts are regions where healthy food options are not easily accessible to residents due to insufficient amounts of grocery stores within a practical traveling distance. Food deserts predominantly affect low-income people of color, as research shows that wealthy neighborhoods have 3 or more times the amount of grocery stores than poorer neighborhoods. Food deserts are an environmental justice issue because the lack of affordable, nutritional food is a harmful environmental condition affecting society’s most vulnerable communities. The negative health impacts residents of food deserts face include malnutrition, diabetes, obesity, cardiovascular disease, and a host of other concerns.
Wildfire resilience: Wildfires are one type of natural disaster exacerbated by the rising global temperatures associated with climate change. Wildfires, a common occurrence across much of the United States, are burning longer and covering more area than prior decades. With wildfires destroying thousands of homes and other structures each year, those that suffer most are low-income and under-insured individuals who struggle to recover from such significant losses.
Flooding vulnerability: Climate change increases flooding severity. Whether through weather events or sea level rise, flooding will disproportionately affect already-vulnerable communities. One study estimates that one in ten low-income housing projects are located in areas with a direct risk of flooding, affecting nearly half a million people. This estimate is likely to be even higher, as it is based off of historical climate data and did not account for recently observed changes in climate. Additionally, with the often unaffordable $700/year cost of flood insurance, many low-income individuals and families cannot financially recover from property loss or damage.
Hurricane preparation and resilience: Climate change increases the wind speeds, rain levels, and storm surges of hurricanes, making them more destructive and deadly. Inequalities in community preparation and recovery from hurricanes negatively impact already-disadvantaged communities. One example of these injustices can be seen in Puerto Rico’s nearly 11-month long delay in electricity restoration following Hurricane Maria. Another example can be seen in how poor and disabled Houston residents were unable to heed Hurricane Harvey evacuation notices, likely a result of not having sufficient resources or capabilities to do so.
Pesticide exposure: Pesticides are potent chemical substances used to control insects, rodents, molds, and other organisms that pose a threat to agricultural yields. Pesticide exposure is an environmental justice issue that most affects the United States’ low-income and primarily Hispanic farmworker population. These workers often suffer from disproportionate and chronic exposures to harmful pesticide components such as chlorpyrifos, paraquat, and phorate. Scientists link pesticides to a host of harmful health impacts, and farmworkers have suffered from illnesses ranging from Parkinson’s disease, to blindness, to a long list of cancers.
Climate migration:Climate migration describes the forced movement of people from their region of residence because of climate change-related concerns. Climate migration can refer to movement across state or international borders, and can be caused by many dangerous environmental conditions such as sea level rise, drought, frequent hurricanes, deadly wildfires, and more. Because climate change will undoubtedly hit marginalized populations the hardest, those forced to become climate migrants will likely be low-income and minority individuals.
Inadequate governmental preparation for natural disasters in disadvantaged communities: With climate change resulting in increasingly severe natural disasters, sufficient planning to ensure human safety is vital. However, in the face of natural disasters, socioeconomic disparities in governmental preparation puts marginalized communities at a much higher risk. For example, this lack of preparation proved immensely fatal during Hurricane Katrina in 2005, where over 1,800 New Orleans residents lost their lives. The improper maintenance of dams and levees in predominantly black neighborhoods allowed them to fail and create massive floods. Additionally, the government did not correctly prepare or implement evacuation procedures, leading to hundreds of avoidable deaths.
Image 2.1 – This image illustrates the noticeable difference in the number of evacuees between wealthier and poorer New Orleans neighborhoods during Hurricane Barry. The French Quarter, a more affluent region of New Orleans, saw higher rates of evacuations in response to a dangerous flood warning (colored in red). Poorer individuals from the Lower Ninth-Ward neighborhoods were unable to evacuate as well (colored in blue), likely due to fewer financial resources for alternative housing and/or a lack of transportation.
Image 2.2 – Created by the Minnesota Pollution Control Agency, this image details Minnesota’s ongoing struggle with environmental injustices. Overwhelming data supports the idea that Minnesota’s low-income communities and communities of color experience air pollutant exposure on a higher level than the state average.
Arguments Against Environmental Justice
As previously discussed, the Environmental Justice Movement aims to create a society where everyone, regardless of socioeconomic status, experiences the same degree of environmental protection and access to environmental benefits. Thus, environmental justice advocates commonly believe citizens have a right to environmental equity, and therefore work to promote both environmental conservation and social justice. However, not everyone agrees with the goals and methods of the Environmental Justice Movement. Critics of environmental justice believe that the resulting increase in government intervention (e.g., stricter regulations) is unnecessary, and only provides politicians with more power to harm and control American citizens. They claim the stricter rules and regulations following environmental justice advancements would inadvertently prevent the creation of jobs and reduce economic output.
Furthermore, because climate change itself is an environmental justice issue that puts disadvantaged groups in an even more vulnerable position, climate change deniers and/or those who dismiss the seriousness of climate change perpetuate these unjust conditions. Denying or diminishing the impact of humans on the global climate can promote environmentally harmful activities such as fossil fuel combustion, and those consequences most affect marginalized communities. In other words, if someone does not view climate change as an issue, they will not have motivation to address it or its environmental justice implications.
Finally, because environmental injustices widely impact low-income and homeless communities, some are hesitant to offer forms of aid and protection as they believe poverty is simply a result of one’s work ethic. They attribute economic success to persistence, grit, and effort, and economic deprivation to laziness, substance abuse, and low moral values. External factors and other uncontrollable circumstances are usually considered less relevant to economic circumstances. As a result, some believe that those disproportionately burdened by poor environmental conditions are either deserving of their current circumstances, or are simply not doing enough to improve them.
Appendix 1 provides a description of key terms relating to environmental justice. For those new to the field of environmental justice, it can be helpful to either read Appendix 1 in advance or refer to it while reading the report.
Further Reading
Report on the people and buildings vulnerable to the flooding effects of climate change:
The Historical Overview section begins with an analysis of European colonization’s influences on today’s environmental injustices, continues with descriptions of early conservation movements hostile to indigenous peoples, describes increasing attention to civil rights and environmental issues during the mid-20th century, and concludes with a discussion of modern environmental discourse and its resulting social movements.
15th century-19th century: European Arrival, Colonization, and Racism
European colonization of lands now known as the Americas continues to greatly influence the way many Americans treat the natural environment, as well as one another. The beliefs held by many early European settlers persisted across several centuries and created a tradition of racism and anti-environment sentiments that have contributed to, and continue to exacerbate, environmental injustices.
Indigenous peoples throughout North America give deep spiritual, social, economic, and cultural significance to their traditional lands. Viewing themselves as a part of nature rather than separate from it, native groups sought to protect the environment and ensure proper and sustainable management practices. For example, indigenous groups recognized the importance of fires in certain ecosystems, and would often carry out strategic land burnings to promote nutrient cycling, foster ecological health, and prevent uncontrollable wildfires.
Unlike indigenous peoples, however, European colonizers believed that humans were separate from nature, and that nature was something to be conquered, commodified, and exploited. European settlers’ disregard for sustainable indigenous practices led to severe environmental degradation that persists today. Overfishing and overhunting of many wildlife species led to severe population declines and/or extinctions. Aggressive wildfire suppression over centuries results in increasingly destructive fires fueled by years of plant debris accumulation. Widespread deforestation reduced the United States forest cover by hundreds of millions of acres, and exacerbated climate change by decreasing carbon sequestration rates.
Additionally, racist beliefs held by European colonizers perpetuated the idea that certain races and ethnicities are inferior and less deserving of dignified lifestyles. Natives faced cruelty and violence at the hands of European colonizers, such as massacres, forced removal from their ancestral homelands, forced cultural assimilation, mass starvations via food supply limitations, and more. Today, those anti-indigenous beliefs have translated into many native groups being subjected to some of the worst environmental conditions in the nation. Major concerns on native lands include abandoned and contaminated uranium mines, leaking oil-transportation pipelines, disparities in clean water access, and air pollution, to name a few. However, European colonizers’ racism extended past indigenous groups and also included a variety of other ethnicities.
Another major manifestation of European settlers’ racism is seen in the enslavement of Africans. Selling human beings as property to be exploited for labor severely dehumanized enslaved individuals. Treated as sub-human, enslaved Africans were often subjected to notoriously poor conditions at the hands of both slave-owners and many white community members. The end of slavery in the mid-1800’s was not the end of racism against black individuals, as discriminatory beliefs against African Americans passed down from generation to generation still permeated many aspects of American life. Today, one example of continued racism against black communities can be seen in the variety of environmental injustices they face. In comparison to white communities, black communities are 75% more likely to be located near oil and gas refineries, are more likely to live in regions with uncontrolled toxic waste, and are at a higher risk of developing air pollution-related illnesses such as asthma. Furthermore, African Americans own significantly less wealth than non-Hispanic white individuals, experience higher rates of food insecurity, and are more economically vulnerable to natural disasters. The environmental inequities faced by black communities come in many forms, and many are rooted in the racism they have experienced for centuries. In short, hundreds of years of European colonization and racism has played a major role in many of the environmental injustices observable today.
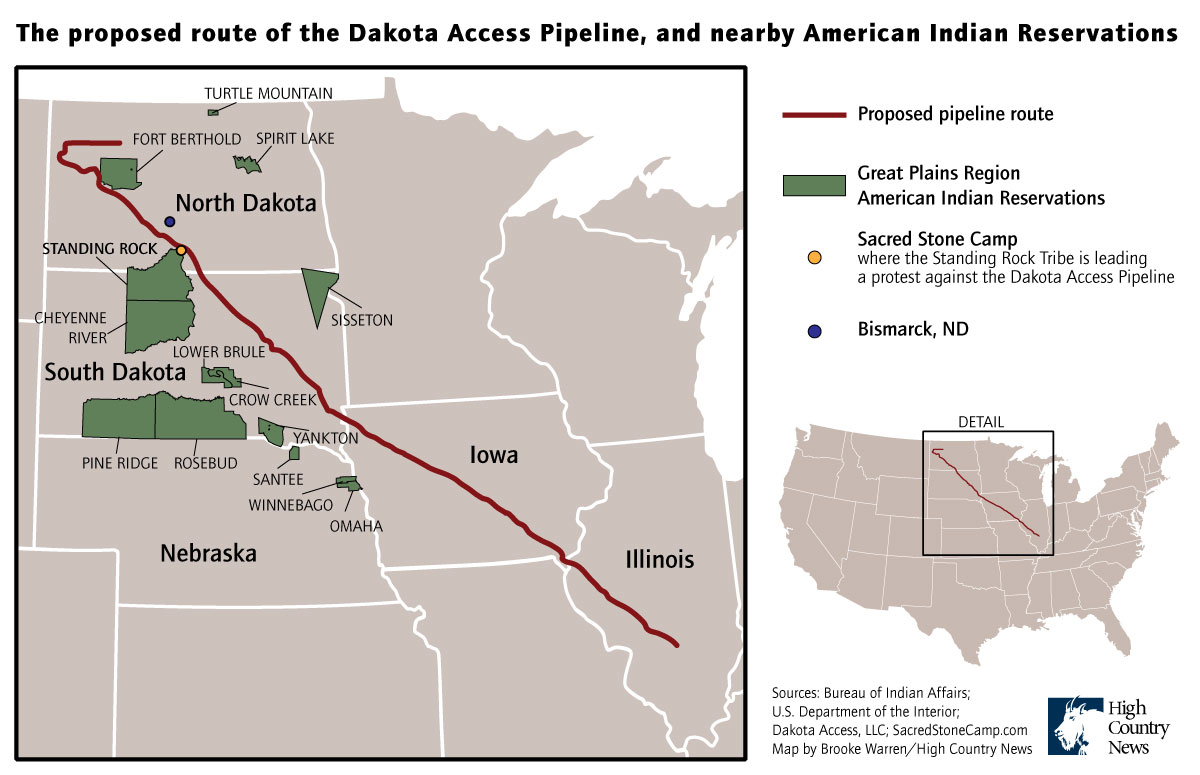
Image 3.1: This image contains information on the Dakota Access Pipeline, an underground oil transportation line that spans approximately 1200 miles through 4 different states. This pipeline created significant controversy due to its likelihood of contaminating the environment and the water supplies many Indigenous tribes rely on. This image details how close the pipeline runs to various Native reservations, which puts their health at risk.
19th Century-early 20th Century: Early Conservation Movement and the Rise of Anti-Asian Discrimination
The mid-19th century marked the beginning of the American conservation movement, a period of time where many advancements towards wilderness preservation took place. Prominent voices of this time period included President Theodore Roosevelt, Henry David Thoreau, and John Muir. Conservationists of this time period sought to protect nature’s scenic beauty. Many of the protected areas established during the early American conservation movement still stand today, such as Yosemite National Park, Mesa Verde National Park, and the Grand Canyon National Park. These protected areas not only allow wildlife species to thrive within their boundaries, they also foster environmental stewardship amongst the American public and provide valuable ecosystem services such as water and air purification.
However, even when advances were made towards environmental preservation, those efforts were largely harmful to indigenous peoples, as they tended to exclude and displace these groups from their ancestral lands. Native groups were often quickly and violently removed from their homes, or pushed out over several decades. For example, in 1886 the United States Army forcefully gained control of the Yellowstone National Park region and used violent measures to discourage Natives from returning. In 1895 the Blackfeet tribe, faced with starvation from the US government’s widespread buffalo killings and insufficient rations, sold 800,000 acres of their reservation in order to purchase food and supplies for their people. By 1897, that land was designated as a forest reserve, and was later used to establish Glacier National park in 1910. John Muir, one of the most prominent faces of the early conservation movement, stated that indigenous peoples “have no right place in the landscape.” Early conservation efforts were almost exclusively made with the intent to benefit white, middle- and upper-class citizens.
Anti-Asian discrimination also became more prevalent during the latter half of the 19th century as more Asians immigrated to America to pursue job opportunities. Their early contributions were vital in aiding the country’s development, as they worked as farmers, miners, fishermen, railroad constructors, and factory workers. Throughout their long history of settlement in the United States, however, Asian Americans have continuously faced labor exploitation, exclusion, violence, xenophobia, and many other forms of inequities. The legacy of early anti-Asian racism still harms today’s Asian communities in a number of ways, including environmental injustices. To name a few examples, Asian Americans often live in areas with uncontrolled and dangerous waste sites, work in overcrowded and chemical-laden garment factories, and face greater cancer risks from air pollution than white individuals. Although environmental injustices against Asians are under-researched and often under-discussed, it is nevertheless important to acknowledge the inequities they face.
Mid-20th Century: Civil Rights Movement and the Modern American Conservation Movement
The modern conservation movement of the 1960’s and onwards was another important era for environmental policy. This era saw increasing attention and political energy centered around the public and ecological health effects of various human activities such as pollution and chemical use. Unlike the early conservation movement which predominantly focused on natural resource protection for aesthetic and recreational purposes, this movement also centered around less-apparent human and ecological health implications.
In 1962, Rachel Carson published Silent Spring, a now-famous book exposing the dangerous environmental and human health effects of widespread pesticide usage, something once thought to be relatively harmless. Carson dedicates most of the book to discussing the environmental effects, such as bioaccumulation, and how pesticides cause significantly more wildlife deaths than those they intend to kill. She also examines cases of human poisoning from pesticides, such as a physician who experienced permanent nerve damage after a year of using a lawn pesticide. The public outcry following Silent Spring’s publication served as one major catalyst for stronger pieces of environmental legislation, and a “Golden Age” of environmental policy followed. Many strong environmental laws, agencies, and policies were created between the 1960’s and 1970’s, including the Clean Air Act of 1963, the Clean Water Act of 1972, and the National Environmental Policy Act of 1969. The EPA was also established in December of 1970.
While this time period was marked by major environmental protection efforts, many policymakers had not yet understood that the burden of unhealthy environmental conditions were disproportionately placed onto marginalized communities. The country was still grappling with basic civil rights concerns such as segregation, disenfranchisement, and legalized racism.
The civil rights movement of the 1960’s was notable for many reasons, such as securing voting rights for black individuals, prohibiting segregation, and increasing economic opportunities for African Americans. While it did not directly evolve into today’s environmental justice movement, the civil rights movement paved the way for environmental justice discourse by emphasizing the public health dangers faced by communities of color.
1980’s to the Present: Environmental Justice Movement
The 1980’s marked the beginning of the modern environmental justice movement. Coherent discourse of environmental justice began in the United States when Dr. Robert Bullard, now known as the “father of environmental justice” began studying how waste disposal sites were distributed across Houston, Texas. His initial beliefs that the placement of these sites were racially motivated were later confirmed. Bullard discovered that the vast majority of waste dumps and incinerators were located in black communities, despite African Americans only accounting for 25% of the city’s population. This prompted Bullard to become a leading academic and activist campaigner against environmental racism, helping to shape our understanding of environmental injustice and combat its many sources.
Environmental justice was not immediately recognized by policymakers and members of the general public; grassroots efforts by early environmental justice advocates led, and still lead, the Environmental Justice Movement we know today. Pioneered primarily by people of color who saw first-hand the public health dangers posed by poor environmental quality in their communities, they sought to find solutions that would ensure the health of themselves and their loved ones.
One of the earliest and most important fights for environmental justice occurred in 1982 during a nonviolent sit-in against Warren County’s PCB Landfill. PCB stands for polychlorinated biphenyls, which are highly toxic organic compounds known to cause birth defects, skin ailments, cancer, and more. North Carolina planned to dispose of 120 million pounds of soil contaminated with PCB in Warren County, a region of the state housing predominantly poor, African American families. Concerned for the health of their community, hundreds of peaceful protesters fought against these plans. Although the protest was ultimately unsuccessful, it spurred the beginning of the Environmental Justice Movement and motivated citizens to examine other instances of environmental injustices across the country.
Throughout the years, the Environmental Justice Movement has had a large number of notable successes, such as national policy changes and strong pieces of environmental legislation. Now a mainstream movement, many local, state, and federal governments actively work towards achieving its goals. The Environmental Justice Movement also constantly evolves, with today’s movement now tackling new types of environmental injustices and embracing the fight against climate change. Although a lack of environmental justice awareness caused generations of marginalized communities to suffer, many are hopeful the future will continue to bring even more positive change.
Toxic Wastes and Race – This 1987 study conducted by the United Church of Christ Commission on Racial Justice was the first to examine and address the links between class, race, and the environment on a national level:
The Current Policies and Challenges section will discuss existing environmental justice policies on a local, state, and national level, examine the ever-changing challenges posed by worsening wealth inequalities, climate change repercussions, and conflicting political party stances on environmental justice issues.
Local Policies
Over the last few decades, elected officials on local, state, and federal levels have tried to tackle environmental injustices through legislation and policy changes. Policies on environmental justice are most varied at the local level, and have brought about significant change within their respective communities.
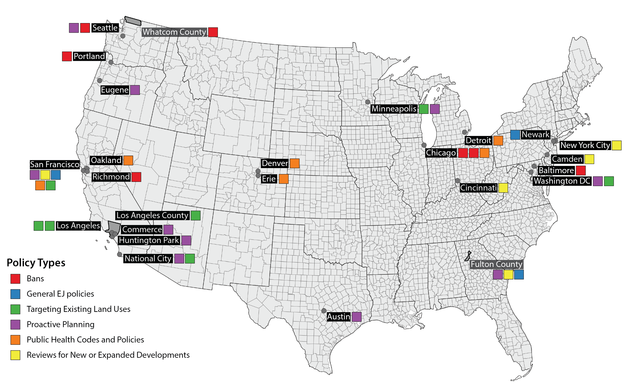
Local policies and laws aimed at combating environmental justice issues are predominantly found in large coastal cities. Although these policies do exist in other areas of the United States, municipalities along the continental coastlines tend to have larger, more established environmental justice communities, as well as political environments that are more accepting of environmental justice reforms. Municipalities typically work towards environmental justice using six strategies:
Bans: Banning specific land uses or industries is a direct and effective way to prevent harmful human activities that put humans and the environment at risk. For example, California’s Oakland region issued Ordinance 13385 in 2016 which stopped coal loading, unloading, storage, stockpiling, and handling within the city. This benefited environmental justice communities who would have faced the greatest environmental burdens and health repercussions from coal facilities.
Environmental Justice Policies and Programs: Establishing policies and instituting programs that affect local decision-making are another way municipalities further environmental justice. An example can be seen in San Francisco’s Environmental Justice Program, which includes a diverse set of steps and programs to promote environmental equity within the city. Those include the creation of parks and open-space areas, a Community Health Plan, and millions of dollars in community grants to nonprofit groups helping vulnerable individuals.
Review Processes: Before a proposed urban development project (e.g. buildings, roads, etc.) can be constructed and put into operation, review processes must first be carried out in order to assess its environmental impact. Municipalities aiming to reduce local environmental injustices often add an environmental justice component to the review process, ensuring that new developments do not disproportionately impact communities already burdened by poor environmental quality. For example, Cincinnati’s 2009 Environmental Justice Ordinance states that all proposed development projects within the city must first obtain an environmental justice permit from the Cincinnati Office of Environmental Quality before operation can begin.
Proactive Planning: Anticipating future city development requires special foresight and planning. Some municipalities address environmental justice by creating comprehensive guides and goals that promote the development of cities in an environmentally equitable way. For example, Eugene, Oregon’s 2013 Envision Eugene Development Plan guides policies for land use planning that consider environmental justice goals.
Targeting Existing Land Uses: Environmental injustices are commonly a result of past permitting of toxic facilities, decades of economic disinvestment, and poor enforcement of environmental standards. It is relatively easier to plan appropriately and prevent environmental injustices from occurring than to deal with existing land use issues. Sometimes, the environmental burdens faced by marginalized communities are so difficult to tackle through land use and zoning approaches that other methods become necessary. Instead, municipalities can utilize targeted mitigation efforts such as the phasing out of harmful land uses, ensuring stronger code enforcement, and creating buffer zones.
Public Health Codes and Policies: Cities adopt and enforce codes that protect citizens from various forms of pollution. These forms of pollution include soil water, and air pollution, and can also include other forms such as noise pollution, odor pollution, and light pollution. One example of cities using health codes to advance environmental equity can be seen in San Francisco’s Health Code Article 38. For new residential construction projects located in areas with poor air quality (commonly areas with large minority and low-income communities), this code protects public health by requiring the installation of stronger ventilation.
Image 4.1: This image from the Natural Resources Defense Council highlights the diversity found in local policies that work towards environmental justice. Although this image is not comprehensive of all local environmental justice policies within the United States, it shows the presence of bans, proactive planning, and other types of reform in various parts of the country.
State Policies
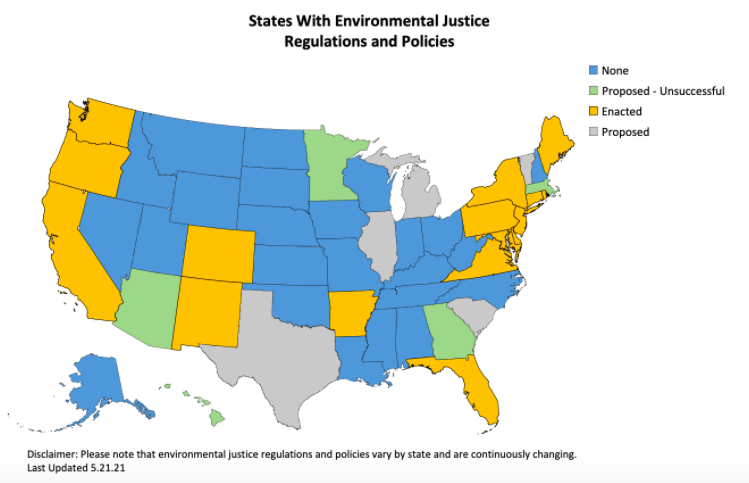
State-level involvement to address environmental injustice can take similarly diverse forms as those seen in local governments. Statewide bans on certain activities, strengthened review processes, establishments of environmental justice programs, and more, are commonly seen in states committed to furthering environmental justice. Some examples of states promoting environmental justice include:
New York: New York’s 2019 Climate Leadership and Community Protection Act is one of the world’s most ambitious climate laws, and a monumental environmental justice effort. As written in the law, actions aimed at reducing the state’s greenhouse gas emissions “should prioritize the safety and health of disadvantaged communities, control potential regressive impacts of future climate change mitigation and adaptation policies on these communities, and prioritize the allocation of public investments in these areas.”
Oregon: In 1997, Oregon’s Department of Environmental Quality adopted an Environmental Justice Policy in order to ensure environmental equity within the state. Some of the principles outlined within the policy included contaminated land cleanups in marginalized communities, encouraging public feedback for the Oregon Environmental Quality Commission, and supporting local environmental justice groups.
California: In 2016, California became the first state to require environmental justice considerations within general city plans. It also provides environmental justice communities with financial benefits taken from the state’s cap-and-trade program on greenhouse gases.
Figure 4.2: This image, taken from a 2021 study on state trends in environmental justice legislation, details which states adopted, or are attempting to adopt, laws that promote environmental justice. Although less than half of all states have fully enacted environmental justice regulations and policies, many others have attempted to do so as well.
National Policies
The federal response to environmental justice issues has not historically been as direct and ambitious as policies found on state and local levels. Environmental justice was first federally validated through Executive Order (EO) 12898, which was signed by President Clinton in 1994. This order instructed federal agencies to identify environmental injustices, implement environmental justice strategies, and promote political participation in decision-making processes. Among EO 12898’s more notable contributions towards environmental equity was aligning the National Environmental Policy Act (NEPA) with environmental justice goals. Although its initial creation in 1969 did not discuss environmental justice, NEPA now strongly encourages federal agencies to consider environmental justice implications before taking any major federal actions or activities.
More recently, the Biden Administration has made strides towards a more environmentally equitable country that is unmatched by past presidencies. In order to protect communities with less political power, Biden has guided agencies to direct funding for environmental justice advancements, incorporated environmental justice goals into environmental reviews, and more. Biden has embraced environmental justice in a way no prior administration has, and many are hopeful that his steps will continue to reduce the environmental burdens experienced by the country’s vulnerable communities.
Challenges: Climate Change
Climate change poses new environmental justice challenges that disproportionately impact already-vulnerable communities. Oftentimes, those who produce the fewest greenhouse gas emissions experience climate change’s greatest risks. Some of the new climate change-related challenges include:
Higher wildfire risks
Extreme high heat levels
Greater heatwave frequency
Greater hurricane severity
Increased flooding severity
Extreme low temperature levels
Reduced agricultural yields
Stronger droughts
Rising sea levels
Increasingly dangerous winter storms
Challenges: Wealth Inequality
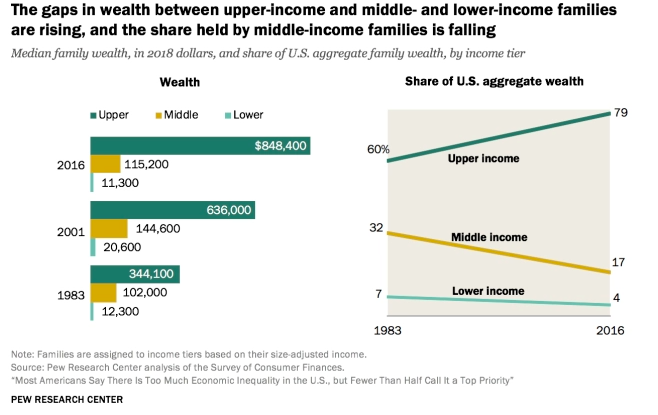
The wealth divide among upper-income families and middle- and lower-income families has risen sharply over the last few decades. Increasingly severe income inequalities between different classes of Americans puts many citizens at an environmental disadvantage. As previously discussed, being low-income or homeless makes one more likely to experience poor environmental conditions such as polluted air, water, and soil. Additionally, as the wealth divide pushes more Americans further into poverty, it reduces their ability to access the decision-making process that shapes the environment in which they live.
Figure 4.3: This image, taken from a 2020 Pew Research Center study, details the increasing wealth gap between American economic classes. Over the last few decades, it is evident that upper income families hold significantly more wealth than years prior, meanwhile lower and middle income families have seen little to no increase.
Challenges: Political Party Conflict
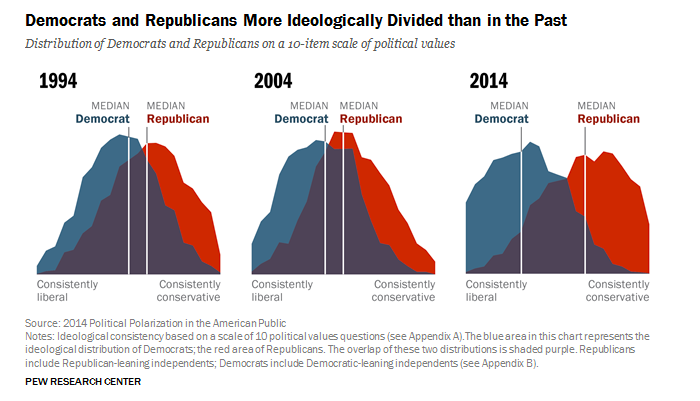
The United States is a hyperpolarized nation, with Democrats and Republicans often finding themselves at opposite ends of many conversations, including those involving environmental justice. According to a 2014 survey conducted by the Pew Research Center, the last few decades have seen more Democrats align with consistently liberal beliefs, and Republicans with consistently conservative beliefs. Partisan animosity is also on the rise, with more Democrats and Republicans harboring highly negative opinions of the opposing party. This hyperpolarization is not only apparent among everyday American citizens; it is especially evident amongst the elected officials who shape the country’s laws and policies.
Restricting funding for the EPA, including its environmental justice programs
Relaxing coal ash regulations under the Resource Conservation and Recovery Act. Because power plants that produce toxic coal ash are usually located in environmental justice communities, this decision had negative implications for vulnerable residents nearby.
Removing the ban on chlorpyrifos, a pesticide with harmful health impacts that primarily impact low-income farm workers.
Cutting funding for environmental law enforcement, creating opportunities for environmental injustices to go unnoticed and unmitigated.
In contrast, the current President Joe Biden expressed a strong commitment to delivering environmental justice early in his presidency. Within the first 90 days of being sworn into office, he:
Signed Executive Order 14008 to address climate change and environmental justice issues
Created two White House councils in order to address environmental justice implementation
Appointed Michael Regan as head of the EPA, who aligned all EPA offices with environmental justice goals
As evidenced by the last two administrations’ stances on climate change and environmental justice, Democrats and Republicans generally do not share similar beliefs and priorities regarding these issues. Without bipartisan agreements and cooperation, progress towards environmental equity may become increasingly difficult to achieve.
Image 4.4 – This image illustrates how the American public has become increasingly politically polarized over the last few decades. Beliefs shared by members of both parties became more divided, with Democrats expressing more consistently liberal opinions and Republicans expressing more consistently conservative opinions.
Further Reading
An examination of environmental justice under the Trump Administration:
The Policy Alternatives and Reforms section discusses recent and ongoing efforts to reduce environmental inequities in the United States, and suggestions for how to adequately address environmental injustices moving forward.
Recent and Ongoing Efforts Within the United States
As of September 2020, New Jersey is now home to one of the United States’ strongest pieces of legislation combating environmental injustices. In September 2020, Governor Phil Murphy signed Senate Bill 232. This bill made it mandatory for certain facilities to undergo a comprehensive review of public health impacts on overburdened communities before an operational permit can be issued. Because this law ensures that the New Jersey Department of Environmental Protection will deny permits to facilities who disproportionately harm vulnerable communities, it is a large and historic step towards environmental equity within the state.
In March 2021, Massachusetts Governor Charlie Baker signed a Climate Law aimed at reducing greenhouse gas emissions and protecting overburdened populations. This new legislation seeks to achieve Net Zero emissions by 2050, and mandates environmental impact assessments for any project that may affect air quality in vulnerable communities.
Six Georgia Representatives recently introduced House Bill 432 in February 2021. If approved, this law would be Georgia’s first-ever piece of legislation that directly addresses environmental inequity. The bill aims to create Georgia’s first Environmental Justice Commission, a group of 22 individuals from diverse backgrounds who analyze facilities across the state and their environmental justice impacts. The Commission would also publicize their findings, and guide legislative efforts it deems necessary to mitigate the burdens faced by disadvantaged communities.
New Jersey Senator Cory Booker recently reintroduced a Congressional bill looking to advance environmental justice goals on a federal level. In August 2021, Booker reintroduced the Environmental Justice Act, stating that “clean air and clean water shouldn’t be luxuries for the privileged”. The bill seeks to advance environmental justice by codifying and expanding EO 12898, requiring cumulative impact analyses under the Clean Water Act and Clean Air Act, Congressionally authorizing environmental justice grant programs, and more.
Improving public transportation to provide rural and/or car-less individuals with better access to grocery stores
Building affordable, government-owned grocery stores selling fresh produce in regions with food deserts
Preparing for Climate Change-Related Disasters
Relocating low-income housing projects away from regions especially vulnerable to flooding
Ensuring proper evacuation of environmental justice communities when faced with wildfire risks, hurricane warnings, etc. through improved public transportation and other evacuation assistance programs
Providing housing for disadvantaged individuals facing severe property damage and/or loss following natural disasters
Monetary Support
Provide financial compensation to residents facing health consequences associated with environmental injustices
Reduce poverty and financially uplift disadvantaged communities
Financially aid the relocation of vulnerable individuals and families living in environmentally harmful/risky regions (e.g. within a close proximity to waste incinerators)
Repurposing abandoned/underutilized urban lots to create green spaces in disadvantaged communities
Valuing Marginalized Voices
Mandating discussions with tribal governments/indigenous communities before making decisions that affect their lands
Spreading Awareness
Encouraging schools to educate students on environmental justice
Reflection Questions
How important is environmental inequity to you? Would you vote for a candidate who did not share your views on this issue?
Can you name any instances where environmental injustices impacted your life/the life of someone you know?
Are you satisfied with the level of attention and political energy environmental justice currently receives? Would you like to see more/less of it?
Do you believe one answer to environmental injustice is increased government intervention and creating more environmental regulations?
Would you consider environmental justice to be in the top tier of your political priorities?
How has your opinion on the importance of environmental justice as a policy issue changed, if at all?
Make Your Voice Heard
Taking action to promote environmental equity does not have to be a daunting task. In fact, there are many ways one can stay involved and bring about meaningful change.
Continue to stay educated: Understanding and continuing to update your knowledge of environmental justice is a powerful first step towards environmental equity. There are many tools you can use to stay informed on environmental justice issues. A few examples are:
The EPA’s environmental justice resource webpage: Includes a long list of websites you can visit to learn more essential information relating to environmental justice.
The EPA’s EJSCREEN mapping tool is one you can use to explore environmental injustices within your community and beyond.
The EJAtlas is a tool you can use to research documented environmental justice issues around the world.
Educate others: Help spread the message of environmental justice by sharing this page and additional ACE resources, such as the environmental justice brief.
Vote for political candidates who prioritize environmental justice.
Contact your representatives: Call or email your House Representative and Senators and tell them you want them to consider environmental justice concerns.
Sample email: Dear [Their name], My name is [Your name] and I am a resident of [your district/state]. I am very concerned about ongoing environmental injustices and I want to see concrete steps to effectively work towards a more environmentally equitable future. The main reforms I would like to see are [list your main issues, for example: making environmental justice analyses mandatory, adequately informing marginalized community members of the environmental risks they face, etc.]. Thank you for your time, and I hope you will take the matter seriously.
Donate or volunteer for elected officials who prioritize environmental justice. Some examples are:
Report environmental violations that you or someone you know has encountered
Support the groups working towards environmental justice: There are many organizations who work to elevate marginalized voices and organize/advocate for more environmentally equitable conditions. You can support them by donating, volunteering, and sharing their content so that it reaches a wider audience. A few examples of such organizations are:
Environmental justice can take on one of two meanings. First, it is commonly used to describe a field of study concerned with the disproportionate environmental burdens and risks experienced by disadvantaged communities. Researchers studying environmental justice often investigate how land use plans, pollution, emergency preparedness, climate change, and other environmental issues unfairly afflict the country’s most vulnerable individuals.
Second, environmental justice can also be used to describe the growing social movement aimed at reducing environmental inequities. The Environmental Justice Movement works to promote and achieve both social justice and environmental conservation goals. Advocates also fight for improvements in the social participation and political engagement of marginalized groups. Greater input from disadvantaged communities ensures that their voices are heard by policymakers, and allows them to shape the decisions that directly affect their lives.
1.2 Environmental Racism
Environmental racism is a concept that stems from the study of environmental justice. Environmental racism falls under the scope of environmental injustices, but is a more specific term that describes environmental inequities arising from one’s race. Dr. Robert Bullard, the father of environmental justice, defines environmental racism as “any policy, practice, or directive that differentially affects or disadvantages (whether intended or unintended) individuals, groups, or communities based on race or color.”
1.3 Climate Change
Climate change describes the long-term changes to Earth’s wind, precipitation, temperature patterns. Current observable changes in the global climate are largely attributable to human activity, such as fossil fuel combustion and other greenhouse gas emissions. These gases enter the Earth’s atmosphere where they absorb heat and radiate it back towards Earth’s surface. Climate change contributes to rising global temperatures, stronger heat waves, drought, sea level rise, destructive hurricanes, and a host of other negative effects. Climate change is an environmental justice issue because its resulting environmental challenges will disproportionately impact already-vulnerable communities.
1.4 Reforms
Political reforms are attempts to improve systems, policies, institutions, or practices that are seen as unsatisfactory. Many environmental justice advocates fight for political reforms that reduce the environmental burdens and risks experienced by disadvantaged communities.
1.5 Grassroots Movement
Grassroots movements are political campaigns organized by everyday people. Through the use of collective action, grassroots groups fight for political change on the local, state, federal, and even international level. Grassroots groups in support of environmental justice continuously work to improve government regulations, environmental policies, and political participation amongst underrepresented groups.
1.6 ColonialismColonialism refers to the violent political and economic control of one country/territory over another. Colonialism aims to exploit dominated regions economically and occupy them with settlers. During colonialism, colonizers often force their religion, culture, language, and economic systems upon the colonized. Today, the United States’ legacy of colonialism continues to harm indigenous communities and the lands they inhabited for millennia
Negotiations between Iran and the United Nations Security Council have been ongoing since Iran was detected building uranium enriched centrifuges in 2002, in violation of International Atomic Energy Agency (IAEA) safeguards. However, negotiations did not result in meaningful action until the Joint Comprehensive Plan of Action. The Joint Comprehensive Plan of Action was signed on July 14, 2015 by Iran, the European Union and the P5+1 (the 5 permanent members of the UN Security Council, which included the United States, the United Kingdom, France, Russia, China and Germany). Iran aimed to relieve sanctions which hindered its economic growth, while the P5+1 wanted to delay Iran’s development of a nuclear weapon. The agreement was gradually fulfilled by both sides until the United States withdrew from the JCPOA under the leadership of President Trump. Under President Joe Biden, the JCPOA has been revived with new negotiations underway.
The journey towards the JCPOA was not entirely smooth. Initially, Iran had already signed onto the Nonproliferation Treaty in 1967 where it agreed to forgo becoming a nuclear armed state. So when Iran was discovered to have secret nuclear sites in 2003, the international community began to worry about what the discovery would mean for the rest of the world, and the Middle Eastern region in particular. If Iran were to attain a nuclear weapon, Israel, which has had a strained relationship with Iran ever since the Gulf War, promised military action would be a consequence. This would potentially trigger a war involving Hezbollah, a Shiite political party and militant group that opposes Israel, or serve as an example to other Arabian states, like Saudi Arabia, that they could also obtain a nuclear weapon without ramifications.
For almost ten years, the international community unsuccessfully tried to find different ways of reaching a deal with Iran. The first negotiations that took place were between Iran and the E3 (France, Germany and the United Kingdom). This agreement had Iran cooperate with the International Atomic Energy Agency, sign the Additional Protocol and temporarily suspend conversion and enrichment activities but not stop enrichment entirely. The agreement between Iran and the E3 was only temporary and a start to a possible long-term solution that could benefit both sides. However, negotiations broke down in 2005 under the newly elected Iranian president Mahmoud Ahmadinejad, who was viewed as a hardliner. Iran announced they would be resuming uranium conversion and rejected the EU3’s proposed Long Term Agreement. For Iran, the agreement was viewed as heavy on demands, light on incentives, and did not adequately compromise with Iran’s demands. Another agreement was proposed in 2008 between Iran and P5+1 which would give Iran access to light water reactor (LWR) technology and a nuclear fuel supply in exchange for Iran’s suspension of enrichment activity. As with the previous agreement, Ahmadinejad refused the offer and instead pushed for more enrichment. In 2011, a potential plan was proposed by the Russian foreign minister Sergey Lavrov. This new plan would involve the gradual lifting of sanctions in exchange for Iran limiting enrichment. The eventual goal would be Iran suspending enrichment entirely and all sanctions being lifted. Iran agreed to the plan, but the United States, United Kingdom, and France refused. Negotiations remained at a stand-still, while the West continued to sanction Iran and Iran continued improving its enrichment capability.
Following a 2011 IAEA report which fully laid out Iran’s nuclear program, the rest of the world realized Iran was only a year or two away from attaining a nuclear weapon. This resulted in an increase in bilateral talks to reach a preferential agreement, one of which took place in 2012 between the P5+1 and Iran. The P5+1 proposal included Iran stopping uranium enrichment up to 20%, shipping out the enriched uranium they had already produced, and closing the Fordow Fuel Enrichment Plant, an uranium enrichment facility in Iran. Iran proposed their own plan which included the recognition of Iran’s right to enrich uranium for peaceful purposes, sanctions relief, cooperation in nuclear energy and safety, and a possible cap on 20% uranium enrichment. Both sides disagreed with the proposals, resulting in further sanctions against Iran.
The JCPOA allowed for 90 days between the Finalization Day and Adoption Day for Iran and the US to begin review processes of the agreement domestically. On Adoption Day, October 18, 2015, Iran and the P5+1 took the steps necessary to meet the commitments listed out in the JCPOA. On Implementation Day, 2016, the IAEA certified that Iran had taken the steps necessary to restrict its nuclear program and allowed for increased IAEA monitoring, which resulted in the U.S., EU and UN relieving some sanctions. In 2023, eight years after adoption day, the UN would lift missile restrictions, Iran would ratify the IAEA Additional Protocol, the EU would terminate all nuclear sanctions, and the United States would remove entities from the sanctioned list and continue sanctions relief. The JCPOA would end in October 2025 in which Iran’s nuclear file would be closed.
In response to the renewed sanctions, Iran began to recede from their JCPOA commitments. Iran began to enrich uranium past 3.67% and invested in research and development of centrifuge technology that did not adhere to IAEA monitoring and safeguards. Iran also notified the IAEA that its stock of heavy water had exceeded 130 metric tons. Additionally, in 2020, Iran passed new legislation to increase nuclear activities by boosting enrichment, increasing monthly uranium output and conducting research and development on centrifuges. Still, Iran continues to allow IAEA inspectors onto sites related to the JCPOA for verification and monitoring. The Biden administration has been more willing to enter into negotiations with Iran on the future of the agreement. Biden has stated that the US would only rejoin the agreement if Iran returns to compliance, but also wants to further broaden the agreement topics to include Iran’s missile program. Iran is willing to return to compliance only to the original deal. Negotiations are currently still taking place between Iran and the P5+1.
Since the establishment of formal diplomatic relations between the United States (US) and the People’s Republic of China (PRC) in 1979, there has been a rapid growth of bilateral trade. Trade in goods and services between the US and China increased from $15.4 billion in 1979 to $180 billion in 2000, growing at roughly 10% annually. This growth accelerated in 2000 when the US granted China permanent normal trade relations (PNTR), which paved the way for China’s accession to the World Trade Organization (WTO) in 2001. This served as a milestone in China’s “reform and opening” process and signified that the US and the global economic community recognized China as an equal partner. To join the WTO, China agreed to numerous conditions, including expanding market access for foreign firms to sell goods and services directly in Chinese domestic markets, lowering import tariffs, and opening the telecommunication and finance sectors to more foreign competition.
There is no doubt that WTO membership greatly benefitted the Chinese economy; expanded access to foreign markets increased net exports and economic growth as productivity increased due to greater competition. However, many in the US argue that China’s accession has hurt the US economy and workers, pointing to the ever-growing bilateral trade deficit, the loss of US manufacturing jobs and growing unemployment, and stagnating US economic growth as evidence that China has used unfair, if not illegal, trade practices to take advantage of the US. These trade practices allegedly include currency manipulation, government subsidies for land, capital, utilities and tax breaks, intellectual property (IP) theft, and lax environmental and worker health and safety standards. Furthermore, many criticize the WTO for its lax enforcement regarding China’s alleged illegal trade practices. While these trade practices have undoubtedly played a role in the bilateral trade deficit, a closer look reveals that it is only partly responsible for a stagnating US economy.
II.Background on Chinese Economic Growth
The People’s Republic of China was established in 1949 by the Chinese Communist Party (CCP). During this period, China struggled with unsuccessful socialist economic reforms and internal turmoil within the CCP. In 1978, Deng Xiaoping, a key political player under Chairman Mao, became paramount leader and began the ‘reform and opening’ process intended to jumpstart the Chinese economy and bring the country out of poverty. Deng echoed the sentiment behind these reforms later in 1992 when he stated:
“After the basic socialist system has been established, it is necessary to fundamentally change the economic structure that has hampered the development of the productive forces and to establish a vigorous socialist economic structure that will promote their development.”
Deng enacted a series of economic policies and reforms, particularly in industry and agriculture, that emphasized individual responsibility and greatly improved productivity. In 1986, China applied for membership in the General Agreement on Tariffs and Trade (GATT, the predecessor organization to the WTO). If granted entry, membership in GATT would greatly expand China’s export market as members would eliminate or reduce import tariffs on Chinese goods, and emphasize China as a destination for foreign direct investment (FDI).
Though Deng’s economic reforms successfully jumpstarted the Chinese economy, the country still struggled with extreme poverty and poor standard of living. China’s GDP per capita placed the country in the top half of low-income countries. In 1990, two-thirds of China’s population, or roughly 750 million people, were living below the International Poverty Line in extreme poverty, defined by the United Nations as living on less than 1.90 international dollars per day.
While foreign direct investment (FDI) increased by a factor of 13 between 1980-92 and 1986-88, the growth largely represents its originally low base. Additionally, though FDI inflows into China were large in the early 1990s, by the end of the decade the growth had stagnated. As shown in Figure 1, FDI inflow remained below 2% of gross domestic product (GDP) and below US$12 billion until 1992, mainly due to Chinese restrictions on FDI, government corruption, and inefficient state-owned enterprises (SOEs). FDI inflows did not begin to significantly increase until 2004, peaking at $290.9 in 2013.
The share of exports of goods and services in China’s gross domestic product (GDP) steadily increased in the 1980s and 1990s. However, total exports remained low as Chinese businesses had limited access to foreign markets and were subject to high import tariffs. Total exports did not begin to significantly increase until 2002, following WTO accession.
The Asian financial crisis in 1997 particularly affected Thailand, Malaysia, South Korea, and Indonesia. As the value of their currency dropped, there were rapid outflows of FDI and the stock market plunged. During this time, China held its exchange rate steady and provided a great source of stability for the region in addition to offering more than $4 billion in financial aid, a stark contrast to President Bill Clinton who described the Southeast Asian economies as temporarily experiencing a “few glitches in the road.” The crisis revealed the vulnerability of the Chinese economy, which was heavily dependent on cheap exports to fuel its rapid economic development. Since then, the Chinese government has emphasized the need to increase domestic consumption and reduce reliance on exports.
The US played a major role in China’s negotiations to join the WTO because the two countries had significant bilateral economic and trade interests, and because of US concerns surrounding how China’s exports would impact the international trade hierarchy. Negotiations stalled in June 1989 following the Tiananmen Square massacre and later in 1991 relating to unfair Chinese trade practices including import restrictions that built up net exports while Chinese companies evaded international rules on exports. Throughout the 1990s, China’s Most Favored Nation (MFN) status was increasingly political and tied to human rights concerns.
To join the WTO, China engaged in bilateral negotiations with each interested WTO member to establish market access concessions and commitments in the goods and services area, including tariffs on industrial and agricultural goods and Chinese commitments to open up its market to foreign services suppliers. China also undertook politically and economically risky reforms to uphold free market values of the WTO as a condition for membership. These included:
Increasing transparency of trade information and law to both foreign and domestic companies
Lowering import tariffs on agricultural and industrial products
Permitting foreign firms to sell directly in Chinese domestic markets
Opening the telecommunication and finance sectors to more foreign competition
Accession to the WTO triggered and accelerated internal domestic reform. WTO rules served China’s own goal of building a socialist market economy, set in 1992 by Deng, and aided in the transition from a decades-long planned economy to a market-oriented economy. Deng used membership requirements for accession to the WTO as a lever to achieve fundamental changes in SOEs and state-owned banks and overcome bureaucratic obstacles. Whereas Chinese import-exports used to be monopolized by a few dozen SOEs and ministries, after accession hundreds of thousands of Chinese enterprises became involved in import-export. This accelerated the volume of Chinese import-exports and expanded the variety of goods they offered. The central government lessened restrictions which previously constrained the private sector, encouraged private investment in industries that were traditionally dominated by SOEs, and reduced top-down control of Chinese enterprises. Productivity growth post-WTO accession also increased, driven by the entry and exit of firms increasingly allowed due to China’s decentralized reforms. SOEs faced greater accountability for their business decisions and faced the full forces of global competition for the first time, which placed pressure on domestic firms to lower their cost structure to survive. Firms that could not compete were forced to exit the market, increasing overall productivity.
China also reallocated labor and capital from farms to factories and from inefficient SOEs to more efficient private businesses. With China’s abundant labor supply and relatively scarce supply of arable land and natural resources, manufacturing was the primary beneficiary of reform-induced industrial restructuring. China’s reorientation toward manufacturing was further aided by substantial inflows of foreign direct investment (FDI). China accounts for 75% of all growth in manufacturing value added that has occurred in low- and middle-income economies since 1990.
Entrance into the WTO provided China with numerous benefits:
It was an important boost to China’s global leadership as it signaled the US and the global economy recognized China as an equal partner.
It strengthened US-China bilateral economic relations, which were strained over the issue of Taiwan and human rights violations.
Chinese exports could access new markets through Most Favorable Nation (MFN) status with all members of the WTO, which allows China to face the same trade barriers as competitors.
China experienced looser investment restrictions, which led to a growth in Chinese capital.
China no longer faced the uncertainty of being hit with high tariffs on its exports to the US. This encouraged Chinese firms to invest in paying the fixed costs associated with engaging in international trade and entering the export market. The US had applied low tariffs on Chinese imports since 1980, but every year Congress met to decide whether to revert to much higher tariff rates that had been assigned to some non-market economies, which averaged 24%.
Read More
Read more about other conditions for China to join the WTO here.
Read China’s White Paper from 2018 that lays out the government’s official position on the US-China trade relationship.
Read more about the role of state-owned enterprises in China’s economy here.
III.Impact of Increased Chinese Imports on the US Economy and Employment
A country’s total trade is measured by the sum of its imports (products it buys from other countries) and its exports (products it sells to other countries), both in goods and services. A trade deficit exists when a country’s net exports (calculated by subtracting imports from exports) is negative, meaning the country imports more goods and services than it exports. A trade surplus exists when the opposite occurs. The US has bilateral trade deficits with some trading partners and bilateral trade surpluses with others. Overall, the US had a trade deficit of $678.7 billion in 2020. Bilateral trade deficits typically occur because countries have certain comparative advantages. For example, the US has the comparative advantage in goods and services that require high degrees of human capital and China has the advantage in light manufacturing.
The US has had a trade imbalance with China since at least 1985 which remained below $85 billion. By 2000, however, the bilateral deficit reached $85 billion and for the first time exceeded the bilateral deficit with Japan. Between 1986 and 2019, the US trade deficit with China grew by 18.4 percent annually. Post-WTO accession, US exports increased as the US gained an export market, but not nearly as much as US imports from China increased. In 2007, US imports with China fell as consumers were hit hard by the recession and purchased fewer goods. US imports also decreased from 2018 to 2019 due to tariffs on Chinese products, though not as much as the decrease in exports.
With the recent 20th anniversary of the U.S. law implementing permanent normal trade relations with China, many politicians and political experts question President Bush’s decision to grant China PNTR status and allege that the Clinton administration and Congress rubberstamped both the law and China’s entry into the WTO. They argue that this fueled China’s rise and the “China Shock”—the period between 1999 and 2011 during which a sizable increase in Chinese imports supposedly produced the loss of approximately 2.4 million U.S. jobs.
Politicians who argue that trade with China has hurt the US economy also point to the decrease in US manufacturing output and in manufacturing employment. In 2000, 17.3 million US workers were employed in manufacturing, decreasing only 9% since the early 1980s. In mid-2007, right before the beginning of the Great Recession, manufacturing employment had already dropped to 13.9 million workers. During the Great Recession, manufacturing lost 20% of its output and 15% of its workforce. By 2010, a year after the Great Recession ended, employment had dropped to 11.5 million workers, a 33% decrease from 2000. Though the US aggregate contraction caused by the Recession undoubtedly contributed to the decrease in manufacturing employment, 60% of the decrease occurred before 2007. Additionally, employment levels have not recovered from the steep decline preceding the recession. Q2 2010 saw the first increase in US workers employed in manufacturing since 2006. By mid-2014, manufacturing employment had increased to 12.1 million workers, but nowhere near where it was in 2000.
Losses in US manufacturing employment are primarily due to the increase in Chinese manufacturing output, which intensified import competition for US firms who experienced a decrease in demand and a corresponding contraction in their workforce. Autor et al. (2013) and Pierce and Schott (2016) estimate the China Shock resulted in a loss of around 1.5 million manufacturing jobs between 1990 and 2007. Acemoglu et al (2014) found that had Chinese manufacturing imports to the US remained stagnant after 1999, there would have been 560,000 fewer manufacturing jobs lost through 2011. In a recent report, the Economic Policy Institute estimated that millions of jobs were lost because “imports displace goods that otherwise would have been made in the United States by domestic workers.”
An analysis by the Cato Institute reveals that new or continued U.S. restrictions on Chinese imports would not have saved the majority of U.S. manufacturing jobs lost during the period of the China Shock. Furthermore, Lincicome argues that China would have joined the WTO and become an economic powerhouse regardless of whether they had PNTR status from the U.S. Instead, he argues that a multitude of policy failures resulted in China’s ability to harm U.S. companies and workers. Some economists adopt an optimistic outlook and emphasize that the value added in manufacturing has been growing as fast as the overall US economy and the share of US GDP has remained stable, a feat experienced by only a few other high-income economies over the same period.
Economic linkages between sectors meant that the effects reverberated through the entire US economy. For example, China’s dominance in exporting apparel and furniture led to unemployment in other downstream industries that supplied US firms with the products necessary to make apparel or furniture. Additionally, much of the impact of increased trade exposure is felt in concentrated areas as suppliers and buyers are often found in the same regional market as to reduce transportation costs.
Many researcher argue that imports from China reallocated jobs from the manufacturing sector in lower human capital areas to the service sector in higher human capital areas. They find evidence of large manufacturing job losses, especially in areas of the US with initially low human capital such as the South and the Midwest, due to plant shrinkage and closures. These areas also experienced declining earnings per worker and little offsetting rise in service jobs. However, they find that areas with initially high human capital experienced limited manufacturing job losses. 50% of this effect is driven by industry switching, where surviving plants change their reported industry code from manufacturing to services (primarily research, management, and wholesale). Furthermore, they find no evidence that large, publicly listed U.S. manufacturing firms suffered from the rise in Chinese imports as their sales, investment, and market value were not affected. They hypothesize that these large firms took advantage of China’s comparative advantage in manufacturing production and exploited their cheap labor and lax environmental standards to offshore manufacturing employment. At the same time, large firms expanded employment in research, design, management, and wholesale activities in the U.S. Overall, Chinese trade weakened the market for labor in low human capital areas relative to high human capital areas and reallocated employment from manufacturing to services, and from US heartland to the coasts.
While manufacturing jobs did decrease as a result of Chinese manufacturing imports, overall US consumers have benefited from China’s accession to the WTO. The aggregate US manufacturing price index dropped by 7.6% between 2000 and 2006 due to China’s WTO entry. Two-thirds of this decrease in price index was due to China lowering their import tariffs in almost all categories of goods. By lowering tariffs on intermediate outputs, the cost of production for Chinese firms decreased, thus allowing them to charge lower prices on goods exported to the US and increase market shares in the US. Chinese exports to the US grew most rapidly in industries that experienced the largest drop in input tariffs. This also led other countries exporting to the US as well as US domestic firms to lower their prices as they received cheaper intermediate inputs from China. Inefficient firms that could not compete with Chinese firms exited the market. The other third was due to the increase in the number of firms and variety of goods exported to the US from China due to both lower input tariffs and China’s PNTR status. The number of Chinese firms exporting to the US more than tripled between 2000 and 2006.
While import competition from China undoubtedly contributed to US job loss, the growth of the information technology (IT) industry in the US and automation further exacerbated this shift in employment away from manufacturing. This shift especially hurt workers in regions of the US with low human capital as well as high-population states with large workforces. This is because automation displaces low-skilled workers while providing job opportunities for high-skill workers. Researchers from Ball State University found that nearly 88% of 5.65 million manufacturing job losses between 2000 and 2010 were due to automation and productivity increases, with trade accounting for just 13.4% of the losses. A study by the Carnegie Endowment for International Peace on manufacturing job losses in Ohio between 1969 and 2009 further found that trade accounts for no more than one-third of job losses. Rather, the majority of losses resulted from other factors, particularly automation and domestic competition with other states.
Furthermore, multifactor productivity (TFP), a measure of the change in an industry’s real output to changes in the combined inputs used in producing that output, was slowing down as output had already realized the gains from improved productivity. Between 1992 and 2004, manufacturing MFP grew by an average of 2% annually. However, between 2004 and 2016 manufacturing MFP declined by an average 0.3% annually. This slowdown of productivity growth coincided with the significant increase in import competition and with a reorganization of production and employment toward non-manufacturing services.
IV.Trade Deficit
The large and ever-increasing bilateral trade deficit between the U.S. and China has been an area of concern for politicians on both sides of the aisle, who emphasize the impact of WTO accession on the US trade deficit and see it as a weakening of the US economy. Many cite the China Shock as the reason for several negative macroeconomic factors including the U.S.’ slowing economic growth and stagnant wage growth. However, it would be incorrect and misleading to blame this on the large bilateral trade deficit between the U.S. and China. Rather, the bilateral deficit between two countries does not adequately reveal who is gaining or losing in a trade relationship and does not tell the whole story of the US-China trade relationship.
Productivity growth and real wages are closely linked. As productivity increases, workers can produce more output in the same or less amount of time, which enables employers to increase wages. However, as Figure 2 shows productivity in the US has been increasing but the typical worker’s compensation has not witnessed the same growth.
Previous economic research emphasizes two explanations for these features. First, globalization has flooded the market with cheap goods from China and eroded domestic manufacturing wages in the process. Second, technology has brought about automation which has destroyed manufacturing jobs.
However, as researchers from Kellogg Insight pointed out, US workers have struggled with wage stagnation for decades. Since the 1970s, growth in real wages, the value of the dollar paid to employees after being adjusted for inflation, has slowed compared to overall economic productivity. Furthermore, China did not begin to flood the market with cheap manufacturing exports until the mid-1990s, as seen in Figure 4. Lastly, job losses due to automation have primarily happened in the last 10 or 15 years. These three reasons suggest that import competition from China cannot be used as an explanation for stagnant wage growth and slowing economic growth.
Despite the causes of these two economic factors, US-China trade relations are a source of concern for many, especially with escalating trade tensions under the Trump and now Biden administration. The interdependence of the US and Chinese economies has served as an “effective brake” on escalating strategic distrust. Both President Biden and President Xi are working to reduce the reliance each nation has on the other.
Another source of stress stems from the US’ current accounts deficit, which is a measurement of a country’s trade where the value of the goods and services it imports exceeds the value of the goods and services which it exports. Because of this, the US typically borrows surplus savings from countries with current accounts surpluses and runs chronic current accounts deficits to attract more foreign capital. In 2020, China overtook Germany to become the world’s largest current account surplus. This was largely because the coronavirus crisis triggered higher demand for personal protective equipment and electronic devices, which boosted Chinese exports. China buys US treasury bonds using its current accounts surplus, and is the second largest US creditor, after Japan.
Many worry, however, that China will use its ownership of American debt as a bargaining chip to hold leverage over the US. However, the dollar is a widely-held and desirable asset in the global economy. While China has been the largest and second largest owner of US debt, the rest of the world (ROW) as well as individuals within the US still own the majority. For example, in August 2015, China reduced its holdings of US debt by roughly $180 billion, though this selloff did not significantly affect the US economy. Additionally, purchasing US debt enables China to manage the exchange rate of its currency, the renminbi. If China were to offload significant amounts of US debt, the exchange rate of the renminbi would rise and would make Chinese exports more expensive in foreign markets.
Continued US debt financing worries economists who are concerned that a sudden stop in capital flows to the US could spark a domestic crisis; though this would only happen if demand for US debt from all financial actors, foreign and domestic, suddenly stopped.
Despite the trade deficit, there are significant benefits to the trade relationship between the US and China. According to a study by Oxford Economics, trade with China supports roughly 2.6 million jobs in the US across a range of industries, including jobs that Chinese companies have created in the US. The continued growth of the Chinese middle class, projected to exceed the population of the US by 2026, also serves as an enormous opportunity for US companies to expand their customer base, which will help bolster employment and economic growth. Furthermore, China’s role in the global supply chain improves the competitiveness of US businesses and lowers US inflation.
Another factor that is often overlooked when tallying the balance of trade in the media is the contribution of US services exports to China. For example, trade data from the US Census Bureau only includes the trade of goods and not services. In 2019, the US exported $56.5 billion and imported $20.1 billion of services to China, a trade surplus of $36.4 billion. Chief US exports include capital products (22% of total exports), industrial supplies (22%), consumer goods (8%), and petroleum (7%).
That Washington and the media place such a high emphasis on the trade deficit with China but not with Japan and the European Union with whom the U.S. also has trade deficits suggests that the trade deficit is used as a scapegoat for other areas of concern that they have with China. These main areas include alleged human rights abuses (such as in Xinjiang or Hong Kong), theft of intellectual property, and more.
Read More
· Read this to learn more about trends in US real wages between 1979 and 2019.
V.U.S.-China Trade War
In the leadup to the 2016 presidential election, Donald Trump used inflammatory comments to call out China, including saying that China was “raping” the U.S. with unfair trade practices and that the country was responsible for the “greatest theft in the history of the world.” Strategically building off of the growing backlash against globalization, Trump pledged to “cut a better deal with China which would help American businesses and workers compete” and accused China of manipulating its currency to make its exports more globally competitive. Steve Bannon, senior White House advisor, claimed that globalists gutted the American working classes and created a middle class in Asia.
Once president, Trump renegotiated and revised trade agreements when US goals were not met. A key example of this is when he pulled out of the Transpacific Partnership (TPP), a multilateral trade agreement that would have created a single market for the US and the 11 countries that border the Pacific Ocean and would have maintained US trade dominance in Asia. Critics of the TPP argue that it would create wealth for multinational corporations rather than US workers.
Trump emphasized 1-on-1 bilateral negotiations with these Asian nations rather than joining the TPP, though he stressed that he would support future trade agreements if they were negotiated on a bilateral basis. This emphasis on bilateral negotiations demonstrates Trump’s belief that the global economy is a zero-sum conflict, where a gain for one party results in a corresponding loss for another party. Under this belief, multilateral negotiations result in allowing other countries to gain at the US’ expense. With bilateral agreements, the US would have greater leverage and be able to capture a greater share of the gains.
Trump’s 2017 Trade Policy Agenda stated that the overarching objective of the trade policy was to “expand trade in a way that is freer and fairer for all Americans.” To achieve this, the Trump Administration would increase economic growth, promote job creation in the U.S., promote reciprocity with the U.S.’ trading partners, strengthen the manufacturing base and the ability to defend the U.S., and expand agricultural and service industry exports. In a not-so-subtle dig at China, the Agenda states that the U.S. should not turn a “blind eye” to unfair trade practices that disadvantage American workers, farmers, ranchers, and businesses in global markets. Rather, Washington should act as “aggressively as needed to discourage” unfair trading practices and to encourage true market competition.
The Trump Administration executed this last statement with the ramping up of U.S.-China trade tensions in the first half of 2018 and the beginning of the trade war in July of 2018. A more complete timeline of the trade war can be found starting in Section 8. The US triggered the trade war starting in February 2018 with tariffs on solar panels meant to target Chinese firms and by initiating a WTO case against China. Trump increased these moves a month later targeting steel and aluminum imports. The next two years saw the imposition of tariffs, retaliatory tariffs, along with WTO cases alleging unfair trade practices from both the US and China.
VI.Effect of the Trade War on the US-China Trade Deficit
Tariffs are taxes paid on imported goods, previously used as a key source of government revenue but more recently used to shield certain industries from foreign competition.
Tariffs are generally paid through three sources.
Foreign companies exporting goods to the US.
Domestic companies importing goods from abroad or using imported inputs in their production processes.
American households as final consumers.
Despite Trump’s insistence that the $79 billion in tariffs were paid by foreign companies, multiple studies have found that this is not the case. One such study found that by December 2018, import tariffs were costing US consumers and the firms that import foreign goods an additional $3.2 billion per month in added tax costs and another $1.4 billion per month in deadweight welfare (efficiency) losses.
Despite President Trump’s claims that the trade deficit hindered US economic growth, real gross domestic product saw an overall decrease between 2017 and 2019, with growth rates increasing from 2.37% to 2.93% but then down to 2.16%. The trade balance is not the only factor contributing to US economic performance and growth, which includes factors like employment, productivity, age of population, and more.
VII.Conclusion
There are a multitude of factors causing the US-China trade deficit, not limited to the US current accounts deficit, Chinese currency manipulation, the shift in the US away from manufacturing jobs and towards service jobs, the growth of the information technology (IT) sector in the US and increased automation, and China’s comparative advantage in manufacturing that allows it to produce inexpensive goods. Furthermore, there are significant benefits to the US-China trade relationship, including lower aggregate prices for US consumers, and the promotion of at least 2.6 million jobs in the US. While increased import competition from China has resulted in the loss of several million manufacturing jobs, hitting the South and Midwest especially hard, overall trade with China has resulted in net job creation. Many view the US-China trade deficit as a sign of decaying US global leadership.
VIII.Timeline of US-China trade relations
1950-1972: US trade embargo with China
In late 1950, China intervened in the Korean War on the North Korean side. Anti-communist rhetoric and propaganda, fueled by the Cold War, contributed to the belief that China was an intrinsic threat to US national security, leading President Truman to retaliate by imposing a total trade embargo with China. At the time, bilateral trade was roughly $200 million annually. President Nixon ended the embargo in 1972 with the hopes that improved US-Sino relations would aid the US in the Cold War with the Soviet Union.
October 25, 1971: China joins UN
The PRC assumed the ROC’s place in the GA as well as its place as one of the five permanent members of the UN Security Council (UNSC).
February 1972: President Nixon makes historic trip to China to meet Chairman Mao
Nixon and Mao signed the Shanghai Communique, setting the stage for improved US-Sino relations by allowing China and the US to discuss difficult issues, particularly the China-Taiwan issue. For the rest of the decade, however, the two countries made slow progress in the normalization of their relations.
1973: First American business delegation visits China since the founding of the PRC
At the time, there was not much bilateral trade or investment because China did not have much to sell to the US and the Chinese did not want to buy from the Americans. The Chinese government was still wary of foreign influence and Chinese culture was not receptive to business with foreign companies, because they wanted to be self-reliant.
January 1, 1979: President Carter grants China full diplomatic recognition
Bilateral trade skyrocketed, creating a US trade surplus. At the time, the only investment model available for foreign companies was to establish a joint venture with a Chinese partner, which brought about conflicts with intellectual property (IP) theft.
1979: China and the US sign trade agreement
The trade agreement enabled Chinese products to receive temporary most favored nation (MFN) tariff status in the US. This made trading with China more attractive by lowering tariffs on goods imported to the US.
1980: Deng Xiaoping launches economic “reform and opening” in attempt to jumpstart China’s economy and improve standard of living
Deng expands access for foreign businesses in China and US, Japanese, and European investment flood China. China also joins the IMF and the World Bank.
Late 1980s and early 1990s: Surge of US investment into the PRC
China relaxed rules on foreign investment, including reforms which gave foreign companies permission to set up wholly foreign-owned enterprises in certain sectors, making it easier and more attractive to invest in China.
June 1989: Tiananmen Square protests
The crackdown on protesters in Beijing’s Tiananmen Square marked a turning point for US-China trade relations as investors question whether China is a healthy and stable market and as the US implemented economic and trade sanctions as punishment for Beijing’s human rights violation. US-China relations became a political argument, notably during the 1992 presidential election campaign when Democratic nominee Bill Clinton accused incumbent Republican George H. W. Bush of being “soft” on China, particularly in relation to human rights, as he resisted calls for punitive measures following the Tiananmen Square massacre.
1997: Asian financial crisis
October 10, 2000: US-China Relations Act of 2000
President Clinton granted permanent Normal Trade Relations (NTR) to China. This decision paved the way for China to ascend to the WTO. It reduced both tariff and nontariff barriers and fully opened the service sector to increased foreign ownership, especially in financial services, telecommunications, and distribution.
December 11, 2001: China enters the World Trade Organization (WTO)
After 15 years of negotiation, China finally gained accession to the WTO. It was a transformational moment in the global economy, marking the beginning of a new era of globalization. China’s trade with the world increased. The WTO is a global international organization that handles the rules of trade between nations to help producers of goods and services, exporters, and importers conduct business
2006: China surpassed Mexico as the US’ second-biggest trading partner, after Canada
2007: Chinese financial markets officially open to foreign investors under WTO rules
2008-2017: China signed free trade agreements with Association of Southeast Asian Nations (ASEAN) bloc and others
September 2008: China became the largest US foreign creditor
China surpassed Japan and owned around $600 billion in US debt. This marked a growing interdependence between the US and Chinese economies and concerns over US-China economic imbalances grew.
August 2010: China surpassed Japan to become the world’s second-largest economy
November 2011: US pivot toward Asia
Secretary of State, Hillary Clinton called for increased investment (diplomatic, economic, strategic, etc.) in the Asia-Pacific region as a move to counter China’s growing clout.
2015: China announced its Made in China 2025 plan
This was the first industrial policy to indicate that China was interested in and capable of capturing global market share in high-tech industries that had been traditionally dominated by Western companies.
2015: IMF added the Chinese yuan to its list of reserve currencies
February 3, 2016: Trans-Pacific Partnership is signed
Twelve countries (including the US), covering 40% of the world economy, signed the Trans-Pacific Partnership under President Obama. The TPP is advertised by President Obama as a “new type of trade deal that puts American workers first” and would help the US compete with China. The deal eliminated more than 18,000 taxes that various countries put on Made in America products. It also promoted a free and open internet, prevented unfair laws that restrict the free flow of data and information, and included the strongest labor standards and environmental commitments in history. The agreement included a 2-year ratification period in which at least 6 signatory countries must approve the final text for the deal in order for it to be implemented.
January 20, 2017: President Trump is sworn into office
He was known for having an “America first” economic platform and was skeptical of free trade norms. Trump felt that China was “ripping off” the US and taking advantage of free trade rules to the detriment of US firms operating in China.
May 2017: US Secretary of Commerce, Wilbur Ross, unveiled a 10-part agreement between Beijing and Washington to expand trade of products and services such as beef, poultry, and electronic payments. The agreement did not address more contentious trade issues including aluminum, car parts, and steel.
February 4, 2018: TPP was signed without the US
February 7, 2018: US implements new tariffs
The “global safeguard tariff” levied a 30% tariff on all solar panel imports (except those from Canada) and a 20% tariff on washing machine imports. Solar panel imports were worth $8.5 billion and washing machine imports were worth 1.8 billion
March 22, 2018: US filed WTO case against China
President Trump signed a memorandum filing a WTO case against China for their discriminatory licensing practices.
March 23, 2018: US put in place new steel tariffs
Following months of threats, President Trump announced major penalty tariffs of 25% on all steel imports (with the exception of Argentina, Australia, Brazil, and South Korea) and a 10% tariff on aluminum imports (with the exception of Argentina and Australia). President Trump claimed these imports “threaten national security” and target China’s alleged unfair trade practices. Steel imports were worth at least $60 billion.
April 2, 2018: China imposed retaliatory tariffs
China’s tariffs ranged from 15 to 25% on 128 US products worth $3 billion. This stoked growing fears of a trade war between the two biggest economies in the world.
July 6, 2018: US-China trade war officially began as US implements first China-specific tariff
The Trump administration imposed new tariffs on $34 billion of Chinese goods. More than 800 Chinese products in the industrial and transport sector faced a 25% import tax. China retaliated by imposing a 25% tariff on 545 goods originating from the US, worth $34 billion, including agricultural products, automobiles, and aquatic products.
August 3, 2018: China announced a second round of tariffs on US products
August 14, 2018: China filed a WTO claim against the US
The claim focused on US tariffs on solar panels and alleged that the US tariffs damaged China’s trade interests.
August 23, 2018: US and China implemented second round of tariffs and China filed a second WTO complaint against the US
China retaliated and imposed a 25% tariff on 333 goods, worth $16 billion.
September 24, 2018: US and China implemented third round of tariffs
October 4, 2018: Vice President Mike Pence delivered a critical speech against Beijing
Pence accused China of predatory economic practices, military aggression against the US, and of trying to undermine President Trump and harm his chances of winning re-election. Pence stated that the US will prioritize competition over cooperation by using tariffs to combat “economic aggression”
December 2, 2018: US and China agreed to a temporary truce
The truce aimed to de-escalate trade tensions, following a working dinner at the G20 Summit in Argentina. Both the US and China agreed to refrain from increasing tariffs or imposing new tariffs for 90 days as the two negotiated for a larger agreement.
December 14, 2018: China temporarily lowered tariffs on US automobiles for three months.
US auto imports are subjected to China’s standard 15% tariff rate on foreign autos. The suspension of additional tariffs is extended on March 31, 2019.
April 1, 2019: China banned all strains of fentanyl
Chinese fentanyl production and distribution had been a source of tension in bilateral relations because of the opioid crisis in the US.
April 10, 2019: US and China agreed to establish trade deal enforcement officers to monitor the enforcement of the trade deal, which has not yet been finalized
May 10, 2019: Trade war intensified
The US increased tariffs on $200 billion worth of Chinese goods from 10% to 25%. President Trump stated that he believes the high costs imposed by the tariffs will force China to make a deal favorable to the US.
May 13, 2019: China retaliated and announced it will increase tariffs on $60 billion worth of US goods starting June 1
May 16, 2019: US Department of Commerce announced the addition of Huawei Technologies Co. Ltd and its affiliates on its “entity list,” which effectively banned US companies from selling to the Chinese telecommunications company without US government approval.
June 2, 2019: China issued a white paper on US-China economic relations found here.
The paper denounced US unilateral and protectionist measures, criticized its backtracking on Sino-US trade talks, and demonstrated China’s stance on trade consultations and the pursuit of reasonable solutions.
June 21, 2019: US Department of Commerce added 5 more Chinese companies to its “entity list”
Sugon, the Wuxi Jiangnan Institute of Computing Technology, Higon, Chengdu Haiguang Integrated Circuit, and Chengdu Haiguang Microelectronics Technology were added to the list.
August 6, 2019: US Treasury labeled China as a currency manipulator
The yuan sank to 7 against the US dollar in apparent retaliation to the new punitive tariffs threatened to apply on the remainder of Chinese imports. China denied the accusations. The US later dropped this designation days before signing the phase one trade deal.
August 23, 2019: China announced $75 billion in tariffs on US goods.
September 1, 2019: US began implementing tariffs on more than $125 billion worth of Chinese imports.
September 2, 2019: China lodged a WTO tariff case against the US
According to WTO rules, the US has 60 days to try to settle the latest dispute.
October 11, 2019: President Trump announced that the US and China have reached a “Phase 1” agreement and that the US will delay a tariff increase.
November 1, 2019: WTO stated that China can impose compensatory sanctions on US imports worth $3.6 billion for the US failure to abide by anti-dumping rules on Chinese products.
January 15, 2020: US and China signed the ‘Phase 1’ trade deal, easing 18-month trade tensions
The trade deal relaxed some US tariffs on Chinese imports and committed China to buying an additional $200 billion worth of American goods (including agricultural products and cars) over 2 years, though the majority of tariffs remain in place
January 20, 2021: President Biden is sworn into office and planned to remain tough on China
Cabinet members signalled that Biden plans to take a multilateral approach by enlisting the support of Western allies to maximize Washington’s leverage on Beijing.