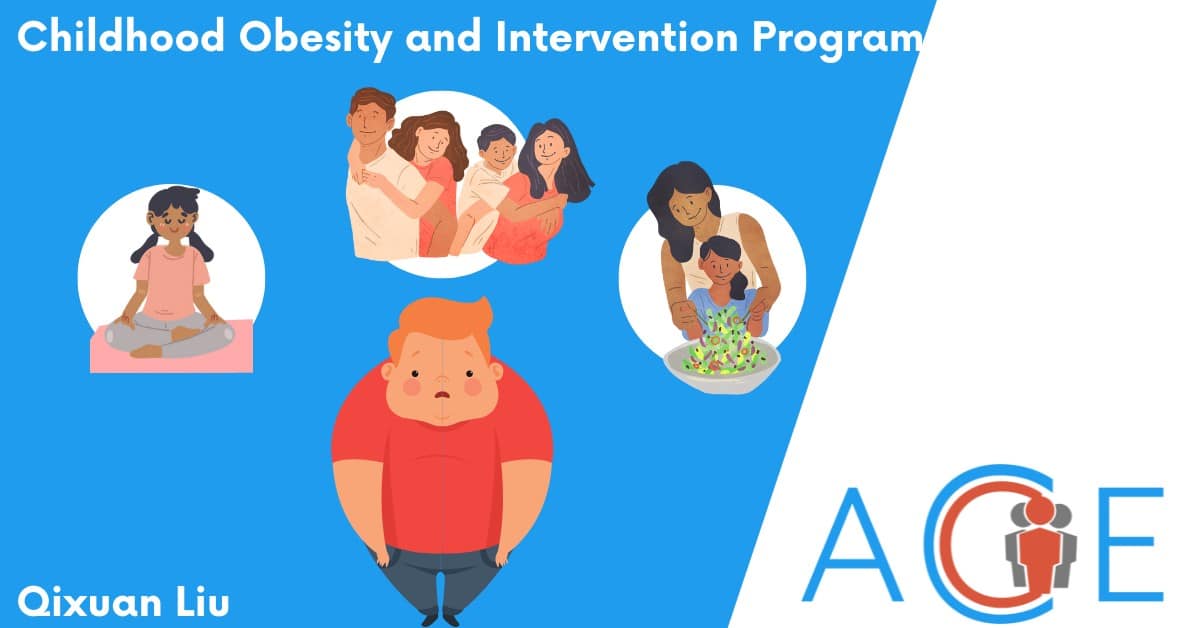
Category: ACE Research

  • Childhood Obesity and Intervention Programs

    Childhood Obesity and Intervention Programs

    Background

    Obesity is a severe health concern across the world, and can contribute to other health problems including cardiovascular risk factors, high blood pressure, and social and psychological problems. Currently, more than 30% of U.S adults are obese and obesity rates are high among U.S children. According to the Division of Health and Nutrition Examination Surveys, obesity rates in U.S children and teenagers has more than tripled since the 1970s. The most recent Centers for Disease Control and Prevention (CDC) data shows that about 20% of U.S children are obese. Adolescents have a higher prevalence of obesity (22.2%) than children aged 2-5 years (12.7%). The childhood obesity rate is disproportional among race groups. Hispanic children are more likely to be obese (26.2%) than non-Hispanic Black children (24.8%), non-Hispanic White children (16.6%), and non-Hispanic Asian children (9.0%). 

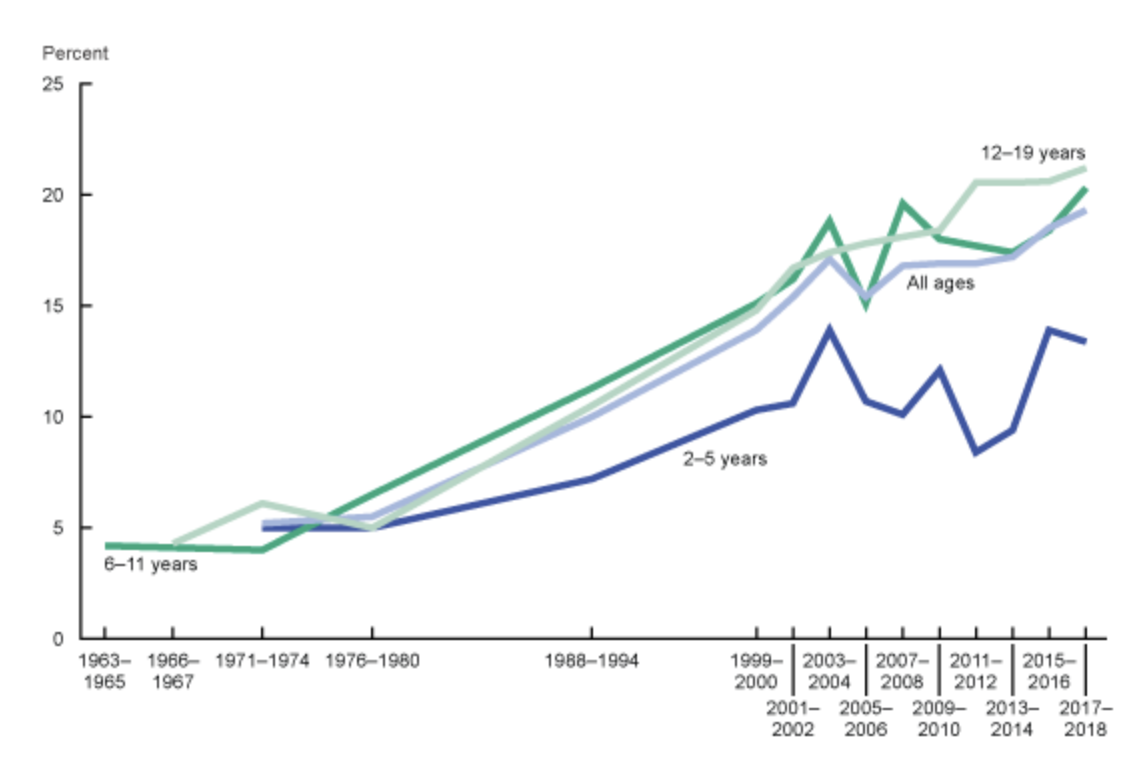
    The obesity rate among U.S children aged 2-19 years old, 1963-1965 through 2017-2018. (Source: National Center for Health Statistics

    Childhood obesity is a serious public health issue because it affects the physical and mental health of children, and it can have major ramifications for their adulthood health. Obesity can lead to high blood pressure, diabetes, and other illnesses later in life. Childhood obesity could also cause mental problems such as depression and poor self-esteem. Simmonds et. al.’s study suggested that a person with a history of childhood obesity is five times more likely to develop obesity in adulthood than those without a history of childhood obesity. 

    Causes of Childhood Obesity

    Children are more susceptible to external environmental influences because they are immature and not financially independent. The causes of childhood obesity can be categorized as lifestyle issues, family influences, and socioeconomic factors. 

    • Lifestyle issues: The leading causes of childhood obesity are the same as common obesity. Having unbalanced or unhealthy diets—for example, consuming high-calorie foods, candies, and sugar-sweetened beverages—cause excess weight gain. Physically inactive children are at risk of developing childhood obesity. 
    • Family influences: Highly controlled parental feeding styles—including pressuring or forcing children to eat and rewarding them with food—increase the prevalence of childhood obesity. The study also found that parents preferred to buy high-calorie, low-nutrient food for their kids because they believed their kids would like such kinds of food.
    • Socioeconomic factors: The Centers for Disease Control and Prevention (CDC) states that a lack of access to public facilities increases the childhood obesity rate. About 40% of U.S households do not have full-service grocery stores within their communities. In this case, children are more likely to consume fast food and frozen food rather than fresh fruits and vegetables. More than half of U.S families do not have access to public infrastructures such as parks and playgrounds. Hence, children spend more time on sedentary activities (watching TV and playing video games), which negatively influences their health. 

    Healthy, Hunger-Free Kids Act of 2010 (HHFKA)

    Healthy, Hunger-Free Kids Act of 2010 (HHFKA) promotes low-income children’s access to nutritious food by authorizing financing for federal school lunch and child nutrition programs. The US Department of Agriculture (USDA) reports from 2012-2013 show that 21.5 million U.S students received free or reduced-price meals at school under the influence of the HHFKA. The main terms of the Healthy, Hunger-Free Kids Act of 2010 are as follows:

    1. Implementing nutritional standards: The HHFKA enables the USDA to establish nutritional guidelines for any meals that are offered at schools, including products provided in vending machines and school stores. Schools receive funding to improve nutrient content in school lunch programs and the accessibility of drinking water
    2. Expanding the beneficiary group: More than 115,000 students who satisfy income standards using Medicaid data are enrolled in the school lunch program. HHFKA increases meal plan access to students in low-income communities by simplifying eligibility criteria. At-risk students who are enrolled in after-school programs are also eligible for meal support. 
    3. Increasing program professionalism: HHFKA requires a three-year cycle for school audits to monitor adherence to nutritional standards. Schools are required to provide transparent nutritional information on school meals to parents. HHFKA also provides school food service providers with instruction and technical support. 

    According to Kenney et al.’s study, HHFKA impacted many students in poverty. The prevalence of childhood obesity among impoverished students began to decrease after implementing HHFKA at 9 percent each year. The obesity rate among non-impoverished students was no different during the study period. The study revealed that with the regulation of HHFKA, overall childhood obesity is rising more slowly than expected

    Supplemental Nutrition Assistance Program (SNAP) and Other Childhood Obesity Federal Programs and Policies 

    Supplemental Nutrition Assistance Program (SNAP), the largest nutrition program in the country, offers short-term financial assistance to people who are struggling to pay for food. More than 43 million individuals received help from SNAP in getting access to food and drinks to maintain a healthy and balanced diet. Additional federal policies and programs that help children in the U.S get access to nutritious food and reduce the food insecurity rate and obesity rates among them are listed below. 

    • Child Nutrition Policies: Child nutrition policies vary from state to state, but their common goal is to reduce the food insecurity rate and provide children with nutritious food. Evidence shows that children’s food insecurity decreased by 33% half a year after their families received SNAP benefits. 
    • The Child and Adult Care Food Program (CACFP): Childcare facilities and other programs that provide nutritious food for children and adults receive federal funding from CACFP for compensation. In one day, over 4.2 million children have access to nutritious meals and snacks each day through CACFP. 
    • Dietary Guidelines: The first edition of the Dietary Guidelines for Americans (DGA) 2020-2025 provides nutritional recommendations for people at different life stages. The DGA recommends that children under two do not consume food and beverages with added sugar. The DGA also provides nutrition standards for federal nutrition programs and health policies. 
    • Women, Infants, and Children (WIC) Program: WIC provides the same benefits as SNAP to a different population. WIC promotes breastfeeding and provides healthy foods and nutrition education to eligible pregnant, postpartum, and breastfeeding women, infants, and children under five years old with healthcare and social services to help them maintain a healthy weight. The obesity rate for children ages 2 to 4 years that receive WIC benefits reduced by 1.5% from 2010 to 2018. 

    Challenges of SNAP 

    Under a new USDA policy, only people who benefited from the Temporary Assistance for Needy Families (TANF) program are able to receive SNAP benefits. Because of that, more than 3 million people lost SNAP eligibility. SNAP is funded through block grants, which means the level of funding is set across a designated time period. This could pose a challenge if the SNAP-eligible population grew quickly, like during a recession. Eligibility standards vary state to state, so two SNAP participants who live in different states may receive different benefits even if they have the same circumstances. 

    Benefits of SNAP 

    SNAP reduces poverty and food insecurity, and improves children’s health, indirectly reducing the childhood obesity rate. Children in SNAP-eligible households gain access to nutritious food and drink, which helps them develop healthy eating habits. Children who participated in SNAP also have a decreased risk of developing high blood pressure, heart diseases, diabetes, and other health diseases across their lifetime

  • Preventing Crime Through Deterrence

    Preventing Crime Through Deterrence

    Deterrence is one of the several goals of punishment alongside incapacitation, rehabilitation, and retribution. Deterrence emphasizes that an individual will feel reluctant to commit a crime if the consequences of that punishment are too great. Legislators have utilized deterrence measures to create policies intended to reduce recidivism, sometimes at the cost of reinforcing racial disparities throughout the United States’ criminal justice system. 

    What is Deterrence Theory, and how does it relate to crime prevention?

    Deterrence Theory has three components: certainty, celerity, and severity of punishment, all of which aim to prevent both individuals who may commit a crime as well as other members of society from participating in unwanted behavior. 

    • Deterrence Theory implies that there is a certainty that the person who commits a crime will be caught. If a person believes that they will not be caught, then the threat of any punishment will not be effective;
    • Celerity is the idea that punishment imposed immediately after an offense will likely be more effective than one that is imposed years later;
    • Finally, if the benefit of carrying out a criminal offense outweighs the consequence, then committing a crime may seem like the more advantageous option, even to a rational person. As such, the severity of punishment is perhaps the most important component of Deterrence Theory, demonstrating that the punishment must not only deter individuals who may commit a crime, but also other members of society by positioning criminal behavior as unacceptable. 

    Contemporary deterrence theories are rooted in classical criminological theory. Cesare Becarria’s 1784 “Essay on Crimes and Punishments” and Jeremy Bentham’s 1781 “An Introduction to the Principles of Morals and Legislation” formed the foundation for the revival of Deterrence Theory in the 1970s. Rather than utilizing Deterrence Theory to explain why people commit crime, as was initially intended by founding philosophers such as Becarria and Bentham, economists and criminologists began to view the theory as a solution to crime. Principle assumptions of deterrence theory include:

    1. A target group receives a message, such as “it is wrong to murder, and taking someone’s life may result in a life-term prison sentence;”
    2. The target group perceives the message as a threat;
    3. The target group makes a rational decision as to whether or not they partake in criminal behavior based on the message they received.

    The “Get Tough Approach” to Crime

    After violent crime rates increased by 126% between 1960 and 1970, Congress adopted deterrence theories from classical criminological theory in the 1984 Sentencing Reform Act, which was signed by President Ronald Reagan and served as the beginning of what would eventually become the “Get Tough On Crime” era. The 1984 Sentencing Reform Act set forth a new sentencing structure where any defendant found guilty of any offense under any Federal statute would be sentenced to a set term of imprisonment or probation and a fine in addition to additional sanctions. Legislators and legal scholars posited that mandatory sentences would deter people from committing crimes because harsher consequences would prevent criminal behavior. Despite the lack of evidence supporting these legislators’ claims, such ideology eventually gave birth to President Bill Clinton’s “Tough on Crime” campaigns throughout the 1990s. 

    The 1994 Violent Crime Control and Law Enforcement Act (“the Crime Act”)  included funding for 100,000 more police officers, and implemented the “Three Strikes” policy. Overall, the bill lengthened prison sentences for certain federal crimes and raised mandatory minimum sentencing requirements across the United States. Anyone convicted of a crime under a mandatory minimum would receive at least that sentence. Mandatory minimums were intended to promote uniformity, ensuring that the law would determine a sentence, not the biases of the judge. The Three Strikes Law generally mandates a life sentence for the third offense of violent felonies, imposing harsher punishments for people with lengthy criminal records. Proponents of the Three Strikes Law claim that if a person who committed a crime knows that they face the potential of a life in prison for their next crime, they will not participate in offending behavior. Advocates of the policy contend that the Three Strikes Law protects victims who may fear the return of those who committed the crime, especially in cases involving rape or theft. Opponents of the Three Strikes Law argue that the policy does not deter the most violent crimes, since a life sentence would not prevent a person from committing a crime who acts impulsively. Additionally, out of nearly 34 million serious crimes committed each year in the US, only 3 million result in arrests, so many individuals who consider committing a crime do not anticipate being caught. 

    Truth In Sentencing (TIS) laws restrict the possibility of early release for incarcerated individuals. Such laws aim to limit the amount of time people in prison can earn off of their non-life sentences, which require incarcerated people to serve a substantial portion of their prison sentence before being eligible for release. Additional federal legislation passed as a part of the Crime Act and amended in 1996 gave states grants to expand their prison capacity if they imposed TIS requirements on those who commit violent crimes. The program, known as the Federal TIS Incentive Grant Program, functioned under the 85% Rule, which required states to force those who commit violent crimes to serve at least 85% of their sentence in prison in order to receive the grant. As a result, earning time off of court-appointed sentences through good behavior and participation in prison programming or rehabilitation no longer helped people in prison reduce their prison sentence. New York implemented a 1998 law which required first time offenders to serve 85% of a determinate sentence. Nevada’s TIS laws required anyone who committed a crime to serve 100% of the minimum prison term before becoming eligible for parole.

    Criticisms, “Get Tough” Policies, and their Impact on Racial Minorities 

    Deterrence Theory and related policies aim to reduce crime, but a series of studies indicated that harsher penalties led to increases in crimes of rape, assault, larceny, robbery, burglary, and auto theft. Because criminal acts may be driven by a variety of factors, such as the influence of drugs or alcohol, the existence of harsh penalties is not necessarily a deciding factor in a person’s willingness to commit the crime. Deterrence Theory assumes that human beings are always rational actors that consider the consequences of their behavior before committing a crime, so someone who is temporarily impared would not consider the pros and cons of their actions. Additionally, proponents of Deterrence Theory would assume that more severe sentences reduce a person’s likelihood of committing another crime. However, a 1999 study that reviewed 336,052 people with criminal records dating back to 1958 found that longer prison sentences increased recidivism by 3%. Finally, Deterrence Theory operates under the assumption that there is certainty people will be apprehended for committing a crime, but due to the limits of the US criminal justice system, many crimes do not result in arrest or conviction. Increasing the severity of punishment through longer prison sentences, for instance, would not deter individuals from criminal behavior if they do not believe they will be apprehended. 

    Mandatory minimums aim to create a more equitable criminal justice system, however one effect has been an increase in the power of prosecutors and a reduction in the power of judges in sentencing. Prosecutors have the ability to charge defendants with crimes that trigger mandatory minimum sentences. Previously, a judge had the ability to reduce sentences based on their understanding of the case and the defendant’s risk to society, however TISs moved that decision to prosecutors.
    African-American adults are 5.9 times more likely and Hispanic adults are 3.1 times more likely to be incarcerated than white adults, so imposing life sentences because an individual has a criminal record disproportionately impacts people of color. The Crime Act also expanded the school-to-prison pipeline and increased racial disparities in juvenile justice involvement by creating mandatory minimums that impact low-income children of color who are convicted of multiple crimes. Additionally, prosecutors are twice as likely to pursue a mandatory minimum sentence for African American people than for white people who were charged with the same offense. The 100:1 ratio in the amount of crack cocaine v. powder cocaine that triggered a five year mandatory minimum ultimately led to the mass incarceration of African Americans. Five grams of crack cocaine resulted in the same sentence as 500 grams of powder cocaine, and because the majority of people arrested for crack offenses are African American, the 100:1 ratio created racial disparities in the average length of sentences. The Fair Sentencing Act of 2010 reduced the statutory penalties for crack cocaine offenses to a 18:1 ratio and eliminated the mandatory minimum sentence for simple possession of crack cocaine by increasing statutory fines.

  • Introduction to U.S.-Egypt Relations

    Introduction to U.S.-Egypt Relations

    Egypt is a key strategic partner of the United States in the Middle East and North Africa. The country is historically influential across the Arab world, and is one of the few in the region to have established  long-lasting peace with Israel. The Egyptian government is also staunchly anti-Islamist extremeism and is part of key counter-terrorism partnerships with the U.S. along with the Arab/U.S. alignment against Iran. As a result of their support of major U.S. regional interests, Egypt has become the second largest recipient of U.S. military and financial aid. However, the Arab Spring in 2011 led to volatility in the country, and the first democratically elected President was assassinated. The subsequent rise to power of President Kalil el-Sisi has paralleled a rise in human rights violations and the suppression of free speech and journalism. These issues have called into question the decision of the United States to continue sending a large volume of military aid to the country.

    Fact Sheet

    Population: 102,334,403 (2020 est.)

    Capital: Cairo

    System of Governance: Republic

    President: Abdel Fattah Saeed Hussein Khalil el-Sisi (since: 2014)

    Majority Language: Arabic 

    Majority Religion: Sunni Islam

    GDP Per Capita: 12,607.0 (2020 est)

    Freedom House Rating: Not Free

    History of U.S.-Egypt Strategic Relations

    Modern relations with Egypt began in 1922, after Egypt gained independence from the British Empire. In the post-World War II era Egypt grew to be a key strategic partner for the United States. At the time, Egypt was influential in the Arab League through cultural, media and social diffusion across the region. Egypt’s influence was especially important to the U.S.’ efforts towards achieving a Arab-Israeli peace. Egypt and Israel signed a landmark peace agreement in 1979, facilitated by the United States during the Camp David Accords. This established a long-lasting peace between the two nations and solidified Egypt as a vital U.S. ally in the Middle East. Since then, the U.S. has provided over $50 billion dollars in military aid and $30 billion dollars in economic aid to Egypt. Egypt has also become one of the U.S.’ largest export markets. With the assistance of American aid, the Egyptian military has grown to be one of the most powerful institutions in the country and heavily influences the government.

    Though Egypt has remained a partner for U.S. strategic interests, the political conditions of the country have been volatile in the 21st century, including a revolutionary period between 2011 and 2013 during the Arab Spring. The Arab Spring led to political unrest in Egypt with revolutionary forces ousting the former President, Hosni Mubarak. The first democratically-elected President, Mohammed Morsi, represented the Muslim Brotherhood, and Islamist organization with peaceful and violent factions. He was soon deposed by the defense minister, Abdel Fattah Saeed Hussein Khalil el-Sisi. President Sisi, a counterrevolutionary, has since come down hard on civil liberties in Egypt and perpetrated severe human rights violations. The Washington Report on Middle East Affairs estimates that between 70,000-100,000 political prisoners are imprisoned as of March 2021. In addition, Egypt’s rate of executions tripled from 32 to 107 executions between 2019 and 2020 under President Sisi.  

    President Trump worked closely with President Sisi, even calling him his “favorite dictator,” and made policy changes that advantaged Egypt. For instance, the Grand Ethiopian Renaissance Dam has been a critical geopolitical issue in the region amidst Egypt’s fears that the Ethiopian dam project will negatively impact the flow of water downstream and allow Ethiopia to effectively control Egypt’s water flow. The Trump administration withheld. aid to Ethiopia in an attempt to persuade them to meet Egypt’s demands. Trump also used inflammatory rhetoric when discussing the issue, claiming that Egypt will “end up blowing up the dam.” These actions cumulatively led to damaged relations between Ethiopia and the U.S.

    President Biden did not call President Sisi when he entered office in 2020, despite Egypt being one of America’s closest allies in the region. However, renewed conflict between Israel and Palestinians in the Gaza Strip in 2021 brought U.S. attention back to Egypt. President Biden made two calls to President Sisi, and credited Egypt for helping to end the violence. He also stated the U.S. would review the GERD issue with renewed effort but underscored the importance of improving the human rights in Egypt. In February of 2021 the U.S State Department confirmed a $200 million dollar arms sale to Egypt.

    U.S Strategic Interests

    • Arab and Israel conflict: Egypt was influential in the Arab League, which made them an important ally in the U.S.’ goal to broker peace between the Arab world and Israel. As mentioned above, Egypt mediated a cease fire between Israel and Palestine during the 2021 conflict on the Gaza strip. In the call with President Sisi, President Biden committed to working with Egypt to create lasting peace in the Gaza Strip with Egypt’s help.
    • Counterterrorism: Egypt and the U.S. share an interest in combating Islamic extremism. The Sinai Penninula is home to an active ISIS sect, and all major Egyptian terrorist attacks in 2020 occurred in the region. Egypt joined the U.S. backed coalition against ISIS; however, Egypt only committed to combating ISIS within its own borders. American aid to Egypt is contingent on counterterrorism cooperation. Egypt also coordinates with Somalia and Sudan on counterrorism issues. However, Egypt’s approach to counterterrorism is violent, and the government engages in human rights abuses in the name of stopping Islamic extremism.

    Ongoing policy debates

    Arguments against continuing the U.S.-Egypt partnership:

    1. Egypt is no longer as influential in the Arab league and the current relationship is based on the impression that it maintains that same influence;
    2. The relationship is one-sided: The United States has provided a significant amount of aid with limited return from Egypt. Egypt continues to trade with North Korea, Russia, China and Iran while Egypt’s counterterrorism operations have had limited success in tackling radicalism in the country due to the violence the government uses to try to suppress it;
    3. Human rights: The protection of human rights in the country has rapidly disintegrated since the rise of President Sisi. Numerous reports from human rights groups like Human Rights Watch and Amnesty International  record extreme conditions of torture and violence in Egyptian prisons against political prisoners. Religious freedoms and free press have also been undermined during President Sisi’s time in office.

    Arguments for continuing the U.S.-Egypt partnership/alliance:

    1. The concern that Egypt will turn to Russia for support
    2. Despite the arguments criticizing the U.S. partnership with Egypt, policy advisors are not suggesting pulling out of Egypt. Instead, these policymakers recommend that the U.S. aid package to Egypt should focus on the people rather than strengthening the military and government. 
      1. For instance, Egypt faces a growing water crisis and needs increased investment in its water treatment processes to protect its access to basic necessities. 
    3. Investing in the Egyptian people would promote a message that American attention is focused on human rights concerns in the country and not on bolstering the perpetrators.

    Within academic and policy circles, the below arguments are further discussed as strong motives to continue investing in the U.S.-Egypt relationship:

    1. Egypt still plays a leading role in regional diplomacy despite concerns their influence has weakened as evidenced by their impact during the 2021 Gaza strip conflict.
    2. It is essential to keeping order in the Sinai, Gaza and Egyptian-Israeli border.
    3. If U.S. military action in the region is necessary, Egypt is a possible partner. As they were in the 1990 Gulf War during the UN coalition against Iraq.
    4. Egypt is part of a broad regional alignment countering Iran.

    Promoting human rights and democracy was also a major election promise made by current President Joe Biden; he stated that his intention was to “revitalize our national commitment to advancing human rights and democracy around the world.” However the extent of this promise is yet to be seen. Observers note that there has been a general shift in U.S. foreign policy away from the Middle East which deprioritized Egypt in U.S. strategic interests, as is evidenced by Biden’s delayed call to President Sisi, supporting the President’s election promise. However the $200 million arms sale and his praise for Egypt during the Gaza strip conflict indicates that the relationship may also remain largely unchanged. 

    There is vocal opposition against the U.S.-Egypt partnership amongst the Egyptian population. This is likely due to the American support of the Egyptian military, which has been an oppressive force in Egypt. Should the United States decouple from the Egyptian government, it may result in the creation of a power vacuum, enabling the rise of opposition in an attempt to revive the aims of the 2011 Arab Spring.

  • Preventing Crime Through Incapacitation

    Preventing Crime Through Incapacitation

    What is Incapacitation Theory and how does it relate to crime prevention?

    Similar to Deterrence Theory, Incapacitation Theory follows a reductivist school of thought, meaning that policymakers justify punishment through incapacitation by positioning it as a way to avoid potential future consequences. That being said, Incapacitation Theory operates under the assumption that any person who commits a crime may commit another crime. Incapacitation Theory suggests that people who have committed crimes should be prevented from committing other crimes through removal from society and/or other methods that restrict an individual’s physical ability to commit another crime. 

    Proponents of Selective Incapacitation, an incapacitation strategy within Incapacitation Theory, argue that people who are convicted of committing a crime should be divided into two groups before sentencing:

    1. “Dangerous offenders,” people who pose a high risk of committing further dangerous crimes; and
    2. “Non-dangerous offenders,” people who are unlikely to commit more dangerous crimes if they are released from prison.

    While the intention of Selective Incapacitation supporters may be to avoid overly severe punishments that result in longer sentences and prison overcrowding, there is no known method through which the courts could distinguish dangerous individuals from non-dangerous individuals with accuracy. Sentences based on Selective Incapacitation punish individuals for crimes not yet committed, which runs the risk that people who are identified as dangerous and are incarcerated will not actually commit another crime. 

    There are multiple types of Incapacitation within Incapacitation Theory: 

    • IncarcerationImprisonment serves as the primary method of incapacitation in the United States. Incapacitation through incarceration functions through the perspective that a person who committed a crime cannot commit more crimes in their community while they are carrying out their prison sentence;
    • Capital PunishmentThe Death Penalty is the most severe and permanent form of incapacitation. An individual is not capable of committing any other crimes once they are put to death, so capital punishment fulfills the goal of incapacitation to an extreme degree;
    • Lesser PenaltiesLesser penalties may concern restricting a person from committing a crime rather than completely disabling a person from committing another crime. For instance, revoking an individual’s driver’s license in response to numerous speeding tickets or putting a person on house arrest both achieve restrictive forms of incapacitation.

    Policy Origins of Mass Incarceration in the US

    Following President Richard Nixon’s presidential campaign concerning “law and order,” his administration allocated $1.5 billion in state and local law enforcement grants to prevent crime in America. Soon thereafter, Nixon declared the “War on Drugs,” and Congress passed the Comprehensive Drug Prevention and Control Act (CSA) in 1970 to prevent drug abuse, provide treatment for drug abusers, and strengthen law enforcement authority in the field of drug abuse. The CSA also provided a legal basis for the government’s “War on Drugs.” For instance, New York’s strict 1973 sentencing guidelines known as the “Rockefeller Drug Laws” placed mandatory prison sentences of fifteen years to life for drug dealers and addicts, including marijuana. Some policymakers argue that sentencing laws like the Rockefeller Drug Laws expanded the United State’s prison population from the 330,000 in 1973 to a peak of 2.3 million today. 

    President Ronald Reagan’s administration further expanded Nixon’s “War on Drugs” through the Anti-Drug Abuse Act of 1986, which authorized $1 billion to state and federal law enforcement and mandated harsher penalties in federal drug cases. The policy also expanded the use of no-knock warrants. Reagan’s administration’s drug reform policies resulted in an increase of incarceration rates of non-violent drug offenders from 50,000 in 1980 to over 400,000 in 1997

    The 1994 Crime Bill under President Bill Clinton’s administration paved the way for states to pass more tough-on-crime laws, as coined through Clinton’s “Tough on Crime” era. The 1994 law encouraged prosecutors and police to incarcerate more people and for longer periods of time. The Three Strikes Law, one of the most well known policies under the 1994 Crime Bill, required a minimum sentence of twenty-five years to life for people who commited three crimes with prior serious felony convictions. While Deterrence Theory partly informed the Three Strikes Law, the policy took shape through Incapacitation Theory. In California alone, there were almost 43,000 individuals in prison under the Three Strikes Law as of 2004, which was 26% of the total CA prison population. 

    Due to sentencing policies resulting from the “War on Drugs,” the number of Americans incarcerated for drug offenses has increased from 40,900 in 1980 to 430,926 in 2019. Overall, there has been a 500% increase in US prison and jail populations over the past forty years, with over two million people incarcerated today.

    Effectiveness of Incarceration and the Impact on People of Color

    Despite the steady decrease in violent crime over the past twenty years, the population of people in prison for violent crimes has quintupled since 1984. The National Research Council concluded that although prison growth was a factor in reducing crime “the magnitude of the crime reduction remains highly uncertain and the evidence suggests it was unlikely to have been large.” That being said, higher incarceration rates do not correlate to lower violent crime rates. The Sentencing Project points to two main factors that can explain why the impact of mass incarceration on reducing crime today is limited:

    • Incarceration is not a very effective tool to prevent youth crimes and drug crimes, since those individuals are quickly replaced by other people seeking an income or struggling with addiction.
    • Additionally, people tend to “age out” of crime, where crime drops rapidly when adults reach their 30s and 40s. 

    John Ehrlichman, Counsel and Assistant to the President for Domestic Affairs under President Nixon, later admitted in a “War on Drugs” confessional statement:

    “We knew we couldn’t make it illegal to be either against the war or black, but by getting the public to associate the hippies with marijuana and blacks with heroin, and then criminalizing both heavily, we could disrupt those communities.”

    African Americans make up 12% of the US population, but they account for 44% of the US prison and jail population as the largest single demographic group behind bars. Harsher sentencing laws for drugs disproportionately fell on communities of color after the Reagan administration’s Anti-Drug Abuse Act of 1986. In particular, mandatory minimum sentences that were authorized for drug users as a result of the Anti-Drug Abuse Act of 1986, specifically the 100:1 ratio between crack and powder cocaine sentences, led to wider racial disparities in incarceration rates. After the enactment of federal mandatory minimum sentencing on crack cocaine offenses, the average federal sentence for African Americans was 49% higher than for white people, 38% higher than it was four years prior. Although the Fair Sentencing Act of 2010 reduced the crack and powder cocaine sentencing disparity, Black Americans are incarcerated in state prisons at nearly five times the rate of white people. 

    Incapacitation through Capital Punishment and the Impact on People of Color 

    Proponents of the capital punishment argue that incapacitation through the death penalty ensures that executed individuals who committed a crime are unable to commit another crime. However, there is no evidence pointing to the fact that the death penalty prevents crime more effectively than long term imprisonment, especially since states that have capital punishment do not show significant changes in either crime or murder rates. While capital punishment is a form of incapacitation, it is not more effective than life imprisonment in preventing crime, which explains why thirty-seven states allow juries to sentence defendants to live imprisonment without the possibility of parole instead of the death penalty. 

    Out of the 3,350 people currently on “death row” in the US, more than 40% are African American, and a disproportionate number are Native American, Latino, and Asian. Since October 2002, twelve people have been executed in cases where the defendant was white and the murder victim was black, while 178 African American defendants have beeen executed for murders with white victims, demonstrating the disproportionate impact of the death penalty on people of color.

  • Managing Migration from the Northern Triangle

    Managing Migration from the Northern Triangle

    With the Collaborative Migration Management Strategy, the Biden Administration plans to improve the management of the U.S-Mexico border and asylum claims throughout Mexico and the Northern Triangle to alleviate current pressures on the U.S immigration system. The strategy was announced along with the Root Causes Strategy on July 29, 2021, and is part of Biden’s “Blueprint for a Fair, Orderly, and Humane Immigration System.”

    Migration from Central America has risen substantially since 2010. From 2010 to 2019, the percentage of all asylum grants to nationals from Guatemala, El Salvador, and Honduras increased from 4 to 16%. Rising claims from the Northern Triangle region have contributed to large backlogs at the U.S-Mexico border. The Trump administration responded to this situation with asylum bans, metering, and the controversial “Remain in Mexico” program. Biden plans to take a different approach by using the Collaborative Migration Management Strategy to stabilize populations, expand access to international and local protection, expand labor migration programs, reintegrate returning migrants, create humane management at the border, strengthen messaging on migration, and expand lawful pathways for protection in the U.S.

    The Biden Administration released an update on their efforts on April 20, 2022, stating they had helped the Mexican and Northern Triangle governments:

    • build asylum systems
    • offer funding to victims of trafficking
    • provide reception services
    • arrest human smugglers
    • restart the Central American Minors program 

    More recently, at the Summit of the Americas, the U.S and other countries committed to expanding legal pathways for migrants (especially Central Americans) and information sharing about transnational crime and human smuggling. These agreements reflect plans in the Collaborative Migration Management Strategy, signaling significant changes in transnational migration governance. A month later, in July of 2022, President Biden and Mexican President Andres Manuel López Obrador also discussed migration. López Obrador expressed his support for more temporary work visas. The most popular labor programs for migrants from Mexico and the Northern Triangle are the H-2A (agricultural workers) and H-2B (non-agricultural workers). In 2020, about 90% of H-2A and 70% of H-2B visas went to Mexicans. Guatemalans received less than 2% of H-2As and 4% of H-2Bs, with smaller figures for Salvadorans and Hondurans

    In Favor of the Collaborative Migrant Management Strategy

    Supporters believe the policy change will improve protection pathways and prioritizes meaningful humanitarian assistance for asylum seekers and a safe border. Specifically, expanding in-region and international pathways to asylum is a major positive step for humane migration management. Supporters also see collaborative efforts between the U.S. and neighboring countries as necessary to managing migration to the U.S. Finally, they assert that these frameworks meet today’s challenges and will be well prepared for future ones.

    In Opposition to the Collaborative Migrant Management Strategy

    Critics on the left disagree with the administration’s dependence on the Mexican government to improve its asylum system for Central American migrants. They claim that it is unreliable, continuing to treat migrants as potential security threats, and unable to handle increasing claims. Instead, these critics recommend that the U.S. connect with Mexican NGOs and civil society organizations, who fill in for the government and know best what asylum seekers need. Others are against expanding temporary worker programs because of exploitation and abuse in these structures. For example, temporary work visas create an imbalance of power between migrant laborers and employers because workers’ employment is tied to a single employer. Therefore, critics on the left say a visa increase is ineffective in remedying Central American humanitarian crises because work conditions cannot be improved under the same system

    Critics on the right argue that the policy is ineffective in preventing human smuggling and decreasing immigration flows. Critics claim that admitting unaccompanied minors and family units with asylum programs is counterintuitive to preventing smuggling and trafficking. They say that the government would spend less money on investigations and prosecutions if they resumed the “Remain in Mexico” program. Other conservative critics believe that migration resource centers (part of the plan to expand asylum in Mexico and Central America) would only attract more immigrants, worsening the current border situation. Specifically, amnesty would encourage irregular immigration

    After the Trump presidency, Biden’s Collaborative Migration Management Strategy is a shift in position on asylum and focuses on increasing access to immigration. The debate is over whether creating more pathways for migrants will alleviate pressures on the U.S-Mexico border or worsen them.

  • ACA Since its Enactment: Effects on Healthcare Coverage

    ACA Since its Enactment: Effects on Healthcare Coverage

    On March 23rd of 2010, President Barack Obama signed into law the Patient Protection and Affordable Care Act, a landmark U.S. statute that entails the largest regulatory overhaul and coverage expansion since the enactment of Medicare and Medicaid in the 1960s. Introduced at a time when over 45 million Americans were uninsured, the ACA constituted provisions that required most individuals to have health insurance at the cost of a penalty fee, combat abusive insurance practices, make coverage more easily accessible, and attempted to mitigate increasing healthcare costs. At the vantage point of over a decade since its passage, it’s worth taking a look back on its implications across Medicaid, private, and other sources of healthcare coverage.

    Medicaid Expansion

    In pre-ACA times, Medicaid was generally inaccessible to non-disabled adults under age 65 unless they had minor children. Henceforth, with the intention of attaining coverage for low-income Americans, the ACA called for all states to expand Medicaid coverage for adults up to age 64 with incomes at or below 138% of the federal poverty level (FPL). The federal government would cover 100% of the increased costs until 2016 and incrementally taper to 90% by 2020. 

    Under the ACA, if states were to not participate in the Medicaid expansion, Congress was to invoke the Spending Clause to revoke all of their Medicaid funding. However, the Medicaid expansion was rendered optional after the 2012 Supreme Court ruling of NFIB vs. Sebelius, which deemed termination of all Medicaid funding to noncompliant states as unconstitutionally coercive. As of 2022, 38 states and the District of Columbia have implemented the Medicaid expansion. In the 12 states that have not enacted the initiative, there currently exists a coverage gap where 2.2 million people are eligible for neither premium subsidies in the Marketplace due to below-FPL income nor Medicaid. 

    Marketplace Insurance Subsidies

    Furthermore, for individuals without employer or government-funded insurance, the ACA provides subsidies in the private insurance marketplace. Before 2014, insurance companies practiced medical underwriting where they would evaluate whether to accept an applicant for coverage and at what premium rates if they do. Since individual insurance typically bares greater administrative costs than group policies, securing coverage used to be either too inaccessible or costly especially for patients with pre-existing conditions. 

    Intending to remedy this phenomenon, the ACA provided premium subsidies for individuals with incomes at or below 400% of the FPL, where buyers would spend no more than a predetermined percentage of their income, ranging from 2.06% to 9.78% correlating to their income, on insurance. The cost of a plan that covered approximately 70% of the expected expenses for an insuree in a local insurance marketplace establishes the amount of the provided subsidy. Additionally, the ACA also mandated insurers to reduce copayment of deductible in the form of cost-sharing assistance for individuals making less than 250% of the FPL. Under this provision, a “moderately generous” plan can cover 94% of an insuree’s expected costs. 

    Marketplace Reforms

    Additionally, the ACA transformed the insurance market via a series of reforms targeted at specific existing problems. In establishing “guaranteed issue” and “guaranteed renewal”, the ACA ensured that insurers must accept all applicants at equal premiums regardless of a patient’s pre-existing conditions. Now, the only factors impacting a person’s premium are age, family size, geographical location, and smoking habits. In addition, the law required health plans in the individual and small group markets to cover ten essential health benefits (EHB) that include ambulatory services, emergency services, maternity, and newborn care, hospitalization, and more. 

    Moreover, in foreseeing the potential of sicker individuals entering the insurance Marketplace due to installment of the guaranteed issue and driving up premiums, the ACA sought to incentivize the healthy population of purchasing insurance to balance out the risk pools. For that reason, the ACA imposed the controversial and now-repealed individual mandate, requiring all Americans to have purchased health insurance by 2014 or pay a financial penalty.

    In perhaps its most popular provision known as the dependent-coverage policy, the ACA required all 

    private insurers to offer coverage to dependent children to up 26 years of age on their parents’ plans. Effectuation of this provision concurred with the beginning of a steep decrease in the uninsured rate among the 19-25 years old demographic. At the highest uninsured rate of any group, 33.9% of adults younger than 26 years of age lacked coverage in 2010. By 2013, this percentage had fallen to 26.5% and eventually to a sub-15% in 2016 in the aftermath of the Medicaid expansion and Marketplace creation.

    Basic Health Program (BHP)

    Section 1331 of the ACA enables states to create a Basic Health Program (BHP), a health benefits coverage program that serves as an alternative to the Health Insurance Marketplace for low-income residents whose income fluctuates above and below Medicaid and Children’s Health Insurance (CHIP) levels. Since then, the program has been implemented in New York and Minnesota. Under this plan which will include at least the ten essential health benefits mandated by the ACA, monthly premium and cost-sharing charged to enrollees will not be greater than a qualified health plan (QHP) Marketplace alternative. 

    Effects on Coverage Expansion

    In the metric of expanding coverage in the US, the ACA was largely successful. According to a 2019 US Department of Health and Human Services (HHS) report, enrollment data from late 2020 and early 2021 indicates that approximately 31 million persons gained coverage related to ACA provisions. 

    The breakdown is as follows:

    • 11.3 million Marketplace plan enrollees as of February 2021
    • 14.8 million new Medicaid enrollees due to eligibility expansion as of December 2020
    • 1 million persons enrolled in ACA’s Basic Health Program
    • Close to 4 million persons, known as the “woodwork group”, who had been eligible but previously weren’t covered, are now incentivized to take up Medicaid due to heightened awareness of ACA’s coverage options, reduced administrative barriers to applying, and the individual mandate.

    Acting in tandem with cost-sharing reductions, premium subsidies have substantially decreased premiums and deductibles for those in the lower-income range. In 2019, 87% of the 10.6 million Marketplace plan enrollees benefited from such premium subsidies. Furthermore, in a 2017 study published in the Journal of Health Economics, researchers accredited 40% of the coverage gains to these exchange premium subsidies. However, enrollments, on an annualized basis, since 2015 have been consistently hovering around 10 million persons, which is 60% below previous Congressional Budget Office (CBO) projections. Moreover, in guaranteeing lower- and middle-income employees access to individual market plans with premium tax credits, the ACA had inadvertently prompted 2 million workers to be dropped from their existing employer-sponsored insurance by 2017.

    Deviations from ACA’s Design

    However, the full effects of the Medicaid expansion couldn’t be realized partially due to the coverage gap previously discussed, but also due to Section 1115 waivers issued by President Trump’s administration. Section 1115 of the Social Security Act allows states to impose premiums and increase cost-sharing among new requirements on Medicaid expansion enrollees. In 2018, based on benefiting state governments “in their efforts to improve Medicaid enrollee health and well-being through incentivizing work and community engagement”, the Trump administration approved work requirements of between 80 and 120 hours a month in 13 states. Limited data is available on the coverage loss of these Section 1115 waivers. However, in the case of Arkansas where the waiver was active from June 2018 to March 2019, over 18,000 people, or roughly 25% of those subjected to the work requirement, many of whom were working but were unaware of how to report to Medicaid authorities, were disenrolled from Medicaid after failing to comply. Henceforth, though not a direct intention by the ACA’s crafters, opponents of the ACA have criticized it for being subject to turbulences of the “big government”. 

    Additionally, the repeal of the individual mandate in December of 2017 is expected to disincentivize healthier people from acquiring coverage in the Marketplace and drive up premium prices. In a comparison of pre- and post-repeal insurance levels, research has found a 24% increase in the likelihood of becoming newly uninsured in states with no federal or state mandate.

    What’s Next?

    Under the American Rescue Plan of 2021 (ARP), households above the 400 percent FBL received premium tax credits to improve affordability in the Marketplace. The ARP had increased access to zero-premium plans on the federal healthcare marketplace from 43 percent to 62 percent of uninsured non-elderly adults, as well as access to low-cost plans (under $50 monthly premium) from 57 percent to 73 percent. By the end of the 2022 Open Enrollment Period, Marketplace enrollment had reached an all-time high of 14.5 million people. However, if not extended, the expansion provision is set to expire in 2023. A recent HHS report projects that 3 million current insurees, 15% of the individual market population, will become uninsured in that scenario. 

  • China’s Role in the Ukrainian Crisis and Sino-Russian Relations Viewed from Washington D.C.

    China’s Role in the Ukrainian Crisis and Sino-Russian Relations Viewed from Washington D.C.

    Following the 2014 Donbas War and the military intervention in Syria, Russia has been facing isolation in the international community. However, amid the enmity of the international community, China has grown closer both economically and politically with Russia in the second decade of the 21st century, particularly through the trading of natural resources and cooperation under the Belt and Road Initiative. As Dan Coats, the U.S. Director of National Intelligence, noted in the 2019 Worldwide Threat Assessment of the U.S. Intelligence Community, “China and Russia are more aligned than at any point since the mid-1950s”. During the 2022 Ukrainian crisis, China has been considered by U.S. officials as the largest potential aid towards Putin’s “special military operation” in Ukraine. Directly following the 2022 invasion of Ukraine, the Russian Foreign Ministry described China as one of Russia’s key remaining friends, and Moscow hoped that Beijing would continue to provide rhetorical and substantive assistance. As Wang Yi, the Chinese Foreign Minister announced, China and Russia “will always maintain strategic focus and steadily advance our comprehensive strategic partnership of coordination for a new era.”

    China-Russia Defense and Economic Cooperation

    China and Russia appear to be moving toward a higher level of defense cooperation in recent decades. Since the normalization of relations between China and the Soviet Union in the late 1980s, the two countries have engaged in close military interactions from cooperation in training and arms trade. Suffering from the western arms embargo after 1989, China saw Russia as a crucial source of advanced military equipment and technologies. In 1996, Beijing and Moscow began a “strategic partnership of coordination” that established high-level dialogues on a range of issues, including security and military affairs. The military ties between the two countries reached a higher level in the past decade. Since 2012, the PLA and Russian Armed Forces have conducted 14 joint military exercises. The Russian government also approved the selling of some of its most advanced military equipment to China, including the S-400 surface-to-air missile (SAM) defense system and Sukhoi Su-35 fighter jet.

    The two countries’ converging economic interests also incentivized them to engage in further cooperation in trade and financial strategies. Since the 2014 Dunbas war, state firms and banks in Russia have faced sanctions from the Western powers, hindering the ability of Russia to raise financing in Western markets. After the trade war with the U.S. in 2018, China also began seeking greater independence from the global financial market. Consequently, in order to reduce their reliance on the U.S. dollar and Western capitals, both China and Russia began to embrace the possibility of dedollarization. In 2014, Chinese Premier Li Keqiang signed 38 agreements on a visit to Moscow deepening cooperation on energy and establishing a three-year currency swap deal worth 150 billion yuan (about $24.5 billion). This deal was renewed for another three years in 2017, marking the joint effort for the two countries to pursue financial autonomy. The trading relationships between the two countries received more attention from the public. China and Russia both recognized each other as one of the most important trading partners in the world. China considered oil and natural gas imported from Russia as major substitutes for imports from the OPEC countries and was thus crucial to the energy safety of China. 

    Impact of the Ukraine Invasion on Sino-Russian Relations

    Despite the shared economic and security interests between China and Russia, China remained ambiguous about providing support for Putin’s invasion of Ukraine in 2022. Following the invasion, Chinese Foreign Minister Wang Yi restated China’s understanding of “Russia’s legitimate security concerns” and criticized NATO’s five consecutive rounds of eastward expansion for threatening the national security of Russia. However, China gradually abandoned its anti-west narrative and its emphasis on national security. Although the Chinese leaders continued to reaffirm the close ties between the two countries, China intended to establish itself as a mediator of the Ukrainian crisis and thought to mitigate the conflicts by facilitating peace talks between Russia and Ukraine. 

    While China hoped to expand its influence in Europe by mitigating the Ukrainian crisis, Russia’s ineffectiveness on the battlefield, paired with the increasing investments European nations are making in their defense, gives the United States a better opportunity than ever to pivot to Asia and focus on the more formidable challenge China represents. On the other hand, the military cooperation between the U.S. and its European allies also reached higher levels. The possibility of a Russian invasion contributed to more defense spending across the NATO countries. While the Russian military is proved to be depleted from the war in Ukraine and European countries are willing to increase investments in their defense, the United States can now relocate limited resources to Asia.

    However, a peaceful settlement of the Ukrainian crisis is still necessary for securing U.S. strategic interests in national security and ideology. Firstly, Ukraine has proven to be an important ally of the United States in nuclear proliferation in the past decades. The partnership between Kyiv and Washington D.C. in nuclear proliferation eliminated the large Soviet nuclear arsenal. Second, the Budapest Memorandum in 1994 established Ukraine as a buffer state between the United States and Russia. Therefore, an escalation of the Ukrainian crisis into total war between Russia and the West is a further violation of the Budapest Memorandum and damages the public images of both sides. Third, as two major autocracies in the world, an ideological tie is forming between China and Russia in their collective interests against the United States and the democratic values it represents. Therefore, any direct confrontation between the United States and Russia in Ukraine may turn the Ukrainian crisis into a proxy war like North Korea and Vietnam and eventually lead to a new cold war between the East and the West. In order to protect Ukraine, prevent potential nuclear threats against the U.S. and its European allies, and prevent the conflict between the East and the West from escalating into a new cold war, the United States is likely to seek a peaceful resolution of the on-going war rather than escalation of the conflicts in Ukraine.

    Conclusion

    For Russia, the cost of losing the war in Ukraine may be too high for the Putin regime. The possibility of further Western sanctions and losing public support encouraged Putin to rely on China for further support. Although China is taking cautious steps to position itself in the Ukrainian crisis, a potential Sino-Russian alliance is the last thing the United States wants to see. On the other hand, as a rising power, China is seeking to increase its political and economic influence across Eurasia through programs like the Belt and Road Initiative and the Shanghai Cooperation Organization. As a result, China is hoping to initiate peace talks, and establish itself as a mediator of the conflict.

  • Carbon Pricing Explained

    Carbon Pricing Explained

    Carbon dioxide is a colorless, odorless gas released during the combustion of fossil fuels. As the Sun’s radiation hits Earth’s surface and warms it, much of it is re-radiated back into space as heat. Carbon dioxide in the atmosphere traps heat in the atmosphere, preventing it from leaching into space. This is called the greenhouse effect, and it causes Earth’s temperature to rise. While some other gasses have greater warming potential than carbon dioxide, carbon dioxide is released the most as a byproduct of human activity, accounting for 79% of U.S. emissions in 2020. 

    As the most prevalent greenhouse gas, carbon dioxide is often the focus of policies to cut emissions, and as such is being incorporated into the economic system. Treating carbon as a financial cost is seen as one method of restructuring the global economy to rely less on burning fossil fuels and seek lower cost alternatives, namely renewables that do not emit greenhouse gasses.

    Key Terms

    • Social cost of carbon: The present value in dollars of the future damage caused by each unit of carbon emissions, calculated using models that project population and economic growth, as well as disasters and health impacts from climate change, over several hundred years  — currently estimated by the U.S. government to be $51/ton of CO2
    • Carbon pricing: A method of quantifying costs paid by the public for carbon emissions — in the form of damages to property and health caused by rapid climate change — and assigning a dollar value to each unit of carbon emitted.
    • Carbon tax: Money collected by a government per quantity of carbon emitted.
    • Emissions Trading System (cap-and-trade): Limits total carbon emissions to a set level, and allows emitters to buy and sell emissions credits with each other where the total amount of credits in circulation equals the set limit.

    Social Cost of Carbon

    Carbon emissions can be assigned a price because they have costs that can be quantified. Climate change due to increased carbon dioxide emissions has a wide range of impacts, including extreme weather events, droughts, damage to structures, and injury or death related to heat, flooding, storms, and increased spread of tropical diseases. These impacts can be translated into dollar value costs, which are factored into the complex economic models used to price carbon. The modeling arrives at a dollar value that can be used to assess carbon-emitting actions: the social cost of carbon.

    Due to the complexity—and ultimately the impossibility—of calculating an exact cost per unit of carbon, estimates vary widely. One meta-analysis finds social costs of carbon estimates ranging from -$50 to $8752/ton of CO2. Across U.S. federal agencies, the social cost of carbon currently used is near the lower end of estimates at $51/ton of CO2. Notably, this number is a reinstatement of a 2017 calculation by the federal Interagency Working Group (IWG), which stated in its report that this is an underestimate that does not reflect more recent scientific developments. For example, New York State estimates the cost at $125/ton. The IWG is currently working to reassess the social cost of carbon.

    If an exact social cost of carbon cannot be determined, then what is its use? Its purpose is to provide a tool for estimating the damages associated with carbon emissions, and to give a reference point for potential carbon taxes or Emissions Trading Systems (ETS). Nations can ultimately calculate a cost of carbon informed by their own values—deciding the “cost” of losing lives due to climate induced disasters becomes more of a value judgment than a simple, quantifiable metric.

    The social cost of carbon is not without controversy in U.S. politics, with conservatives often questioning its use and liberals being in favor of using it more often. The Obama administration was the first to implement a social cost of carbon at $51/ton, which was then devalued to $1-$7/ton by the Trump administration, in addition to disbanding the IWG. The Biden administration has restored the IWG and its past estimate, however a recent legal campaign by Republican-led states sought to block the Biden administration from reinstating the $51/ton metric from the Obama era, but failed in the Supreme Court.

    Carbon Pricing Policies

    Many governments have chosen to implement policies that enact carbon pricing that seek to lower emissions by making them expensive. In other words this uses the market to incentivize companies to stop emitting, as opposed to simply mandating emissions to be reduced. By assigning a cost paid for carbon emissions, policymakers hope that companies will try to reduce their carbon footprint as a means to cut costs and maximize profits. The two main policy mechanisms deployed are carbon taxes and ETS.

    • Carbon Taxes: Carbon taxes are a method of pricing carbon and making emitters pay for it by assigning a value to each ton of carbon emitted, and collecting taxes based on this value, multiplied by total emissions. Companies are given the choice of paying for their emissions or avoiding the tax by reducing emissions, and the underlying logic is that a more expensive tax will result in more emissions reductions.
    • Emissions Trading Systems (ETS): Emissions trading systems, also called cap-and-trade programs, are an alternative way of making emitters pay for carbon by setting a limit on cumulative emissions (a cap) and allowing companies to trade emissions allowances with each other, where the total value of all allowances in circulation is equal to the total carbon limit set by the government. This is different from a carbon tax in that carbon taxes do not set a limit, they merely make emitters pay a flat rate per unit of carbon. These systems allow for a more flexible market-based approach, as heavier emitters can buy allowances from less polluting industries and decide whether it is more cost effective to pay for allowances or simply decrease their emissions. ETS where the government gives away allowances for free also especially rewards companies that can lower emissions, because they can sell their allocated allowances to other companies and earn money. A few other key elements of such a system include heavy fines for exceeding allotted emissions, to make it more viable to pay for additional allowances or reduce emissions, and distributing allowances directly (giving them to industries based on their projected emission requirements) or through auctions that let companies bid for allowances as they see fit. 

    Carbon Pricing Debates

    Even when all parties agree that climate change is a serious issue, there are disagreements over the implementation of solutions, including pricing carbon to reduce emissions.

    Those in favor of implementing carbon pricing claim that it is the most effective way of quickly reducing carbon emissions which is a necessary action to prevent catastrophic planetary warming. The World Bank and the International Monetary Fund both support it as a market based strategy to meet emissions reduction targets. Proponents also estimate that a government imposed price on carbon would generate significant revenues for the government, enough to cover the costs of implementing carbon prices. The Tax Foundation projects that a carbon tax of $50/metric ton at an annual growth rate of 5% would generate $1.87 trillion over ten years. They explain that the economic impacts depend on how the tax revenue is spent; if the excess revenue is distributed to workers through tax cuts or direct rebates, it can offset the inherent regressiveness of a carbon tax. 

    A drawback of carbon pricing, and a major barrier to its implementation, is that a rise in fossil fuel prices negatively affects the economy. The UK’s National Institute for Economic and Social Research calculates that an abrupt implementation of a carbon tax set at $100/ton would raise inflation and lower Gross Domestic Product by 1-2% across most Organization for Economic Co-operation and Development (OECD) countries. The inherent problem is that most economies still rely heavily on fossil fuels, so raising the cost of carbon emissions drives up prices across all sectors. This can affect the poorest citizens the most, and the poorest countries as well, where fossil fuels are essential for light, heat, and transportation. Fears over economy-wide price increases are why carbon taxes are generally politically toxic, despite economists claims that they are the most effective measure for reducing emissions.

    Another issue commonly discussed with carbon pricing schemes, and most climate change plans for that matter, is that they rely on international cooperation to be successful. If one country implements carbon pricing, industrial practices may shift to other countries with no carbon pricing, leading to no change in net emissions—a phenomenon known as carbon leakage. For this reason, one of the major policies discussed by global institutions like the IMF has been an international carbon price floor, which would set minimum carbon prices globally and require the involvement of most countries to be effective. Another potential solution being tested in the European Union is deploying a Carbon Border Adjustment Mechanism, that aims to charge equivalent fees on carbon emissions for all goods, including imports, once factoring in any potential carbon emissions paid for in countries of origin.

    As it stands, carbon pricing schemes have not been implemented at the international level, but many countries have some form of carbon price. As of 2022, carbon pricing covers 23% of global greenhouse gas emissions according to a report by the World Bank. Global carbon pricing revenue in 2021 was $84 billion.

    State and Trends of Carbon Pricing 2022, World Bank 

  • Special Immigrant Juvenile Visa Status

    Special Immigrant Juvenile Visa Status

    What is Special Immigrant Juvenile Visa Status?

    Special Immigrant Juvenile Status (SIJS) is a program created by the Immigration Act of 1990, in order to address a growing issue of vulnerable immigrant children that lacked appropriate parental caretakers in the United States. Social service systems and juvenile courts could remove the children from harmful caregivers, enter them in the foster care system, and facilitate adoption. However, upon turning eighteen, these children would run the risk of being deported, and there was no clear way for these children to attain legal status.

    A Special Immigrant Juvenile (SIJ) as defined by the Immigration Act is an immigrant that has been declared dependent on a state court and eligible for foster-care, and for whom it has been found in “administrative or judicial proceedings” that it is not in the child’s best interests to return to their home country. A clause was included which states that the parent of a child granted SIJS cannot qualify in order to prevent children being sent to the United States to petition for an abusive parent’s legal status. 

    The 2008 Trafficking Victims Protection Reauthorization Act (TVPRA) of 2008 expanded eligibility for SIJS, from those declared dependent on the state to also include those committed to the custody of an individual or entity appointed by a state or juvenile court. This allows juveniles that are granted a legal guardian to also apply for SIJS, not just those destined to enter the foster care system.

    Who currently qualifies for SIJS?

    In 2022, to qualify for Special Immigrant Juvenile Status (SIJS), an immigrant must be:

    1. A child that cannot be reunited with one or more parents due to abandonment, abuse, or neglect. 
    2. Under 21 years old, 
    3. Unmarried, and 
    4. Declared a dependent by a juvenile court. 

    What makes SIJS different from other visa programs?

    SIJS is unique among immigration programs in that, in addition to involving the federal immigration court system, it also involves state juvenile court, which is defined by the USCIS as “a court in the United States that has jurisdiction under state law to make judicial determinations about the dependency and/or custody and care of juveniles.” This court can fall under a number of names, varying by state, but the involvement of this court is necessary to filing a valid SIJS application. 

    How does one apply for Special Immigrant Juvenile Status?

    To file an application for SIJS, the applicant must provide the following to the United States Citizenship and Immigration Service (USCIS):

    1. A completed form I-360, Petition for Amerasian, Widow(er), or Special Immigrant
    2. Evidence of the applicant’s age to prove they are a minor, which in immigration court is anyone under 21 years old. Possible documents include a birth certificate, passport, or ID issued by a foreign government.
    3. A valid order from a juvenile state court

    In order to receive the court order, there are a few different processes the applicant may have to go through. Generally, the guardian of the applicant files a case in whichever state juvenile court has jurisdiction, which varies by state and locality. This step generally requires a lawyer, who may be appointed by the state depending on the specifics of the case. 

    The juvenile court must make specific findings for the juvenile to qualify under USCIS qualifications. The most important finding is that reunification with one or more parents is impossible due to abandonment, abuse, neglect, or similar reasons found in state law. Notably, the determination is made based on state law, not federal law, meaning that each state can have different criteria for what qualifies as abandonment, abuse, and neglect. The rules vary by state, with some states requiring that the court order be procured before the juvenile turns 18 or 19, while others allow up to 21 years old like the USCIS. Some states have made different decisions, stating that both parents of a juvenile must be responsible for the abuse, abandonment, or neglect, despite the 2008 TVPRA changing the requirement to one parent. 

    What are the benefits of SIJS status?

    SIJS waives some criteria required by other programs that would render applicants inadmissible. This includes unlawful entry, which is entering the United States in violation of immigration laws, usually by crossing the border in a remote area without inspection, entering with false documents like a fake passport, or entering the United States with a visa the applicant is ineligible for but provided false information in order to receive. SIJS also waives working without authorization, being a public charge, and some other immigration violations.

    Given that those applying for SIJS are usually in removal proceedings, SIJS’s protection from deportation is one of the biggest benefits of the program. The biggest long-term benefit, however, may be that those that are granted SIJS status can apply for permanent residency, commonly known as a “green card.” The green card process can be long, especially for SIJS applicants, as they have to wait for their turn at a limited number of visas, but this status is an important foot in the door to eventually acquiring legal residency.

    With current Biden administration policies, an individual granted SIJS but not yet eligible for a green card can still receive deferred action, which means that prosecutors will not seek removal for a certain period of time, as well as work permits, allowing SIJS holders to work legally in the United States. These are two major benefits as they enable an immigrant to earn money and stay in the United States without violating immigration laws.

    What are the criticisms of SIJS status?

    The current implementation of the SIJS program provides relatively broad privileges, including deferred action and work authorization, as well as certain provisions in the application process, which may result in negative unintended consequences. One of these consequences is that the USCIS is likely to receive many applications with illegitimate or exaggerated information, in order to pursue an easier path to work authorization and deferred action. The quick pathway to a work permit could also lead to exploitation of the juveniles applying, as unaccompanied minors that receive SIJS could work to pay back those that may have smuggled them into the US.

    Another criticism of SIJS as it stands is the variation that exists because of the involvement of state courts. The ABA criticized the variation among state courts, stating that the “disparate result amounts to impermissible immigration adjudication by state courts.” With the relatively open-ended findings the state courts must make, there is room for a lot of variation in judgements, making some immigrants unable to receive the same access to SIJS as immigrants in another state.

  • Medicare Part D

    Medicare Part D

    Introduction

    When the Medicare program was first implemented in 1965 to provide subsidized health coverage for the elderly and disabled, it encompassed inpatient hospital stays and outpatient physician office visits via Medicare’s Part A and Part B, respectively. However, the program didn’t cover self-administered retail prescription drugs, which have long consisted of the largest share of prescription drug use. The Medicare Prescription Drug, Improvement, and Modernization Act (MMA) of 2003, signed into law in 2003 and effectuating in 2006, created an optional outpatient prescription drug benefit program called Medicare Part D or Medicare Rx to help pay for drugs at retail, mail order, home infusion, and long-term care pharmacies. By 2021, 48 million out of the over 62 million Medicare beneficiaries are enrolled in Part D plans.

    In 2018, Part D’s program expenditures reached $95.4 billion, or nearly 13% of total Medicare spending. Part D constitutes more than one-third of retail prescription drug spending in the US. It’s financed primarily by general revenues (71%), beneficiary premiums (17%), and state payments for beneficiaries eligible for both Medicare and Medicaid (12%). 

    Types of Medicare Part D Plans

    Differing from Parts A and B, which are publicly administered by Medicare, Part D is provided by authorized Medicare-contracted private insurers. These companies are subject to Medicare regulations and subsidization, pursuant to one-year, annually renewed terms. There are two main types of plans beneficiaries can enroll in for Part D benefits. 

    1. Prescription Drug Plan (PDP): a standalone plan that covers solely prescription drugs. 
    2. Medicare Advantage Prescription Drug Plan (MA-PD): combines a beneficiary’s doctor, hospital, and prescription drug coverages under one policy. Additionally, employers and unions can extend the Part D coverage from their own MA-PD plans to Medicare-eligible employees and retirees in what’s known as Employer or Union Sponsored Part D Retiree Plans.

    Generally, an individual must have either Part A OR Part B coverage to enroll in a PDP, while he/she would need both Part A AND Part B to enroll in an MA-PD. PDPs tend to be nationwide plans, while MA-PDs have more restricted regions, whether by state or by counties within states. Therefore, MA-PDs aren’t recommended for those who travel extensively or reside in various areas of the country throughout the year. 

    PDP plans also differ from MA-PDs because with PDP plans, beneficiaries’ costs are directly related to the anticipated prescription drug spending of the population. Additionally, PDPs are dictated by costs within the retail drug sector, therefore fluctuations in healthcare costs in other respects such as hospitalization don’t impact PDPs. 

    Costs of Medicare Part D

    Part D operates on an insurance model where enrollees are charged costs typically associated with standard insurance plans, such as monthly premiums, annual deductibles, and copays. In 2022, Medicare Part D coverage costs on average $33 per month, while Medicare Advantage plans will cost $19 per month. 

    Covered Drugs

    Part D plans aren’t required to cover all Part D drugs. Instead they establish their own formularies, with varying tiers associated with accordingly set copay amounts across the categories of drugs. Lower tiers tend to have lower copays. A formulary must follow the model formulary in the US Pharmacopeia, include at least 2 drugs in each of the 148 drug categories, and covers all or “substantially all” drugs under the categories of anti-cancer; antipsychotic; anti-convulsant, antidepressants, immuno-suppressant, and antiretroviral drugs.

    The Standard Benefit

    The law mandates companies to offer a “standard benefit” package at the minimum, including an annual deductible and a coverage gap, known as the “Donut Hole”. While some plans may deviate from the standard benefit in terms of structure, they must be actuarially equivalent. Occasionally, “enhanced” plans may provide more benefits than the baseline set by the “standard benefit”, including more coverage during the Donut Hole period. The section below outlines the Part D standard benefit phases for 2022.

    1. Deductible Phase: Enrollees pay for the full cost of his/her prescription drug until he/she reaches the initial Annual Deductible of $480.
    2. Initial Coverage: The beneficiary would go on to pay 25% of a covered Part D prescription drug, either a copayment (a set amount) or coinsurance (a percentage of the drug’s cost). This amount will depend on the drug’s designated tier. This stage ends when a beneficiary and his/her insurer reach the initial coverage limit of $4,430, or when the beneficiary has paid $1107.50.
    3. Coverage Gap: Prior to 2019, upon the plan and enrollee collectively reaching the initial coverage limit, the enrollee enters the “Donut Hole” phase, where the enrollee would be required to pay a higher percentage of the drug’s full cost than the 25% of the previous phase. The Health Care and Education Reconciliation Act of 2010 (HCERA) established a gradual phase-out of the coverage gap by 2020. With the Bipartisan Budget Act of 2018 (BBA), the Donut Hole for brand-name drugs closed one year ahead. In 2022, enrollees on the standard drug plan will pay 25% coinsurance for both brand name and generic drugs until their true out-of-pocket cost (TrOOP) reaches the catastrophic coverage minimum. The 75% discount on brand-name drugs is 70% paid by the drug manufacturer and 5% by the Part D plan. The TrOOP is calculated by adding together the yearly deductible, coinsurance, and copayments from the entire plan year, and beneficiary contributions during the coverage gap including the 70% Donut Hole manufacturer discount.
    4. Catastrophic Coverage: Once a beneficiary’s TrOOP amounts to $7,050, he/she will pay the greater amount between either 5% of drug costs or $3.70 for generics and $9.20 for brand names. For the remaining costs, roughly 95% of the total, 80% will be covered by Medicare and 15% by the plan. The enrollee will remain in this phase until the end of the plan year before it resets in the new year. 

    Pros of Medicare Part D

    By design, different coverage costs for according “tiers” of drugs are meant to protect consumers from high-cost prescription drugs. At low premiums and a plethora of options, consumers have a wide range of choices depending on their needs and how Part D works alongside their other concurrent coverage plans. 

    Studies have observed the percentage of Medicare beneficiaries forgoing medications due to cost dropped from 15.2% in 2004 to 11.5% in 2006 post-enactment of Part D. A 2020 study also found that Part D led to a sharp reduction in the number of full-time workers older than 65.


    Cons of Medicare Part D

    Medicare enables Part D coverage enrollment around the time of a person’s 65th birthday. However, if a Medicare enrollee goes without Part D or other creditable prescription drug coverage for any continuous interlude of 63 days or more after the end of their Part D Initial Enrollment Period, they are subjected to a late enrollment penalty. The penalty is typically added to the person’s monthly premium amount and its amount increases with how long he/she has gone uninsured. For each full, uncovered month that the enrollee didn’t have Medicare drug coverage or other creditable coverage, 1% of the “national base beneficiary premium” (or the base beneficiary premium) will be added to his/her monthly premium. 

    Given Part D’s formulary structure, a potential enrollee would need to anticipate his/her drug needs for the upcoming plan year and have to shop between various plans on the market. Further, due to plans differing from insurer to insurer other than a Medicare-mandated minimum amount of coverage, this gives enrollees another reason to ensure a particular plan satisfies all drug needs.

    Another key criticism regarding Part D is the “Noninterference Clause”, which prevents Medicare from negotiating Part D prices with drug companies in hopes that private insurers are incentivized to negotiate the lowest possible drug prices. However, since not even the largest insurers have enough enrollee base as leverage, Part D drug prices are largely not negotiated, leading to spending $50 billion a year in the “most conservative high-cost scenario” that otherwise could have been saved between 2006 and 2013. 

    Medicare Part D in the News

    At a time when reining in drug prices has overwhelming public support in the US, the current Senate’s Democratic majority recently reached a deal allowing Medicare to negotiate and place caps on drug price inflation. The crux of the legislation is the negotiation provisions. If passed, Medicare could start the Drug Price Negotiation Program (DPNP) in 2023, with the secretary of the Department of Health and Human Services selecting up to 10 drugs to negotiate prices on, with the negotiated prices effectuating in 2026. In 2029, the number of drugs subjected to bargaining will increase to 20. Furthermore, the legislation will create a $2,000 out-of-pocket spending cap for Part D beneficiaries, prohibiting brand-name manufacturers from hindering competition from generic-drug producing counterparts and requiring companies to pay a rebate for hiking drug prices beyond the rate of inflation. Over the next decade, this plan is projected to save $288 billion.