Isabel is a junior at Emory University majoring in International Studies and History, and she plans on pursuing a law degree after graduation. As a member of the Special Projects team, Isabel is especially interested in work related to space and defense policy, particularly in areas related to Chinese foreign policy and North Korean weapons development programs. She also enjoys working on topics related to our continuing reliance on artificial intelligence and its implications for the international legal system. Isabel is also a dedicated member of Emory’s Model United Nations travel team, and she also heads the committee in charge of planning Emory’s annual collegiate Model UN conference. Outside of her academic interests, Isabel works as a barista and enjoys hiking in national parks and reading classic literature.
Category: Multiple Authors
-
Introduction to the Death Penalty
Individuals convicted of the death penalty are found guilty of capital crimes, most notably, murder, espionage, and treason. In the 1600s, the American colonies used the death penalty as a punishment for most serious crimes. By the 1800s, many began to oppose the death penalty because they felt that it was inhumane and unconstitutional. The 1972 U.S. Supreme Court Case Furman v. Georgia deemed the death penalty unconstitutional in it’s current state, and found that the legal process needed to be revised. This resulted in the emergence of the bifurcation procedure. The bifurcation procedure involves two trials.
- The guilt phase: A jury decides an individual’s guilt or innocence.
- The penalty phase: Following the guilt phase, the jury receives additional information in the form of aggravating and mitigating circumstances that are meant to aid in deciding if the individual is deserving of death. Aggravating circumstances are situations or factors that increase the individual’s deservingness of death while mitigating circumstances are situations that decrease the individual’s deservingness of death.
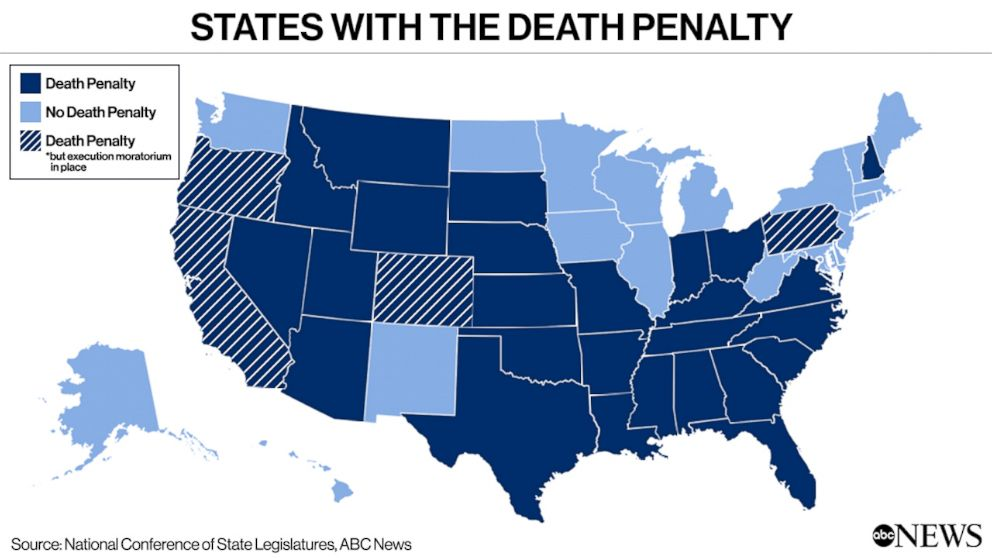
The death penalty is considered a state issue. 27 states use the death penalty and 23 states do not. The U.S. government has imposed moratorium in three death penalty states. This means that the individuals can still be sentenced to death but primarily only in the case of severe crimes, like murder.
Source: ABC News
In 2020, 18 countries implemented the death penalty, but most executions were concentrated in a few countries, namely China, Saudi Arabia, Iraq, and Iran. Saudi Arabia, Iraq, Iran, and Egypt made up about 88% of executions.
Arguments for the Death Penalty
- Deterrence: Death is notably the harshest punishment practiced by the criminal justice system. It is seen as a general deterrence because it prevents individuals from committing capital crimes. Ernest van den Haag, a professor at Jurisprudence at Fordham University, studied the topic of deterrence in terms of the death penalty and believes that since death is the most feared event for most people, it must have some effect in deterring crime. Furthermore, the death penalty specfically deters any future crime because it takes away the criminal’s ability to commit crimes after they are dead.
- Retribution: Those who support the death penalty from a retributionist perspective do so because they find that it serves the purpose of justice. If the death penalty did not exist as a punishment to those who commit capital offenses, they believe society would succumb to crime and violence. This perspective also supports Hammurabi’s code, or “an eye for an eye,” meaning that a crime will be equally matched with a punishment in which the criminal suffers the same pain as the victim. If an individual commits murder, he or she shall be put to death as punishment.
Arguments Against the Death Penalty
- Rebuttal to retribution: The legal system cannot rely on emotional impulses for solving problems because it is not a sufficient justification, especially for such a serious form of punishment. The criminal justice system should be held to higher standards that reflect a prioritization of life. Reducing the reasoning of taking an individual’s life to an emotional aspect is dehumanizing and it acts as a reflection of the entire justice system, and not just a focus on capital crimes punishment.
- Innocence and wrongful convictions: There is strong evidence that proves some individuals have been wrongfully executed. According to the Execution Database, 185 people have been absolved from guilt and released from prison. Although some of the absolutions may have resulted from judicial and investigative errors, this number demonstrates the possibilty for error within the death penalty procedures.
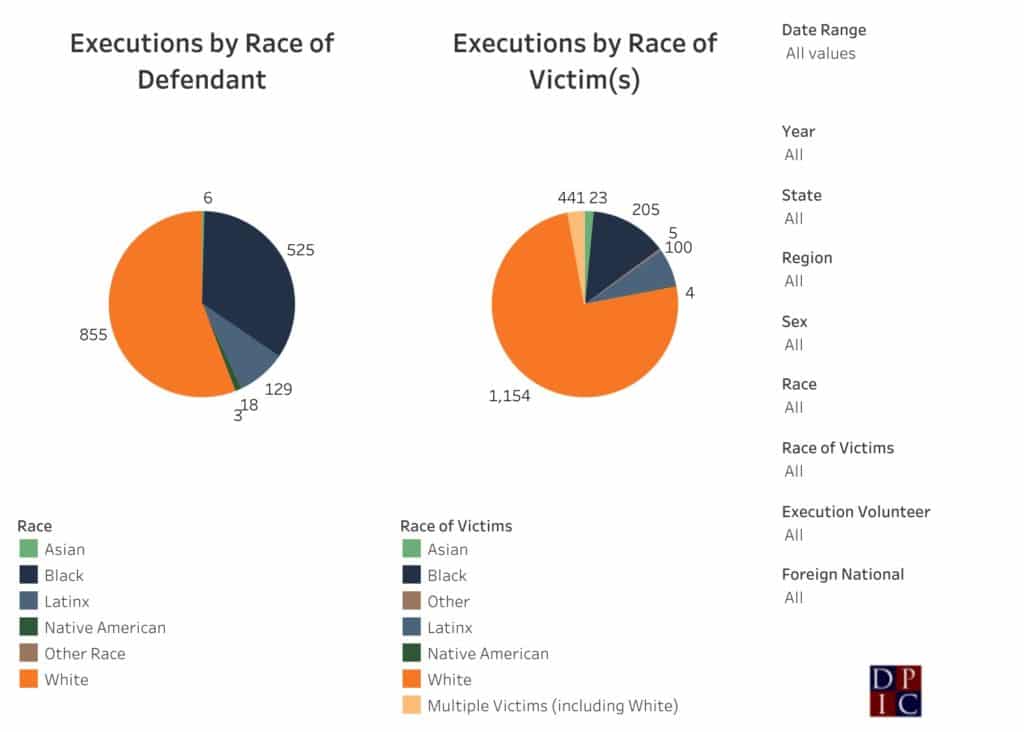
- Arbitrariness and Discrimination: Defendants of disadvantaged backgrounds are more likely to receive the death penalty than other groups. Black individuals convicted of a capital crime are 4.3 times more likely to receive the death penalty than white people. Since 1976, 158 black individuals have been executed by the death penalty for the murder of a white victim while 11 white people were executed for the murder of a black victim. The death penalty does not execute the worst offenders, rather it executes those who have the poorest defense. Those who do not have the resources to afford a lawyer are assigned a public defense lawyer, who is usually juggling multiple cases and unable to strongly focus on a single case.
- Arbitrariness and Discrimination: Defendants of disadvantaged backgrounds are more likely to receive the death penalty than other groups. Black individuals convicted of a capital crime are 4.3 times more likely to receive the death penalty than white people. Since 1976, 158 black individuals have been executed by the death penalty for the murder of a white victim while 11 white people were executed for the murder of a black victim. The death penalty does not execute tthe worst offenders, rather it executes those who have the poorest defense. Those who do not have the resources to afford a lawyer are assigned a public defense lawyer, who is usually juggling multiple cases and unable to strongly focus on a single one single case.
Source: Death Penalty Information Center -
Perspectives on the American Rescue Plan
The American Rescue Plan Act of 2021, or American Rescue Plan, is a COVID-19 stimulus bill consisting of a package of roughly $1 trillion towards economic recovery and assistance in response to the Coronavirus Pandemic. The American Rescue Plan, or ARP, was signed into law by President Biden on March 11, 2021 as an extension of the previous stimulus package. The passing of the ARP comes a year after the Coronavirus Aid, Relief, and Economic Security Act, or the CARES Act, which was signed into law by President Trump on March 27, 2020.
Components of the ARP
The ARP contains many extensions of provided benefits under the CARES Act. One of the prominent extensions included in the ARP is the Pandemic Unemployment Assistance, or the PUA, which is an unemployment insurance program that covers unemployment benefits for qualifying citizens. Under the CARES Act, the PUA was scheduled to terminate in December of 2020 after providing 39 weeks of benefits. This timeline has been extended to 79 weeks under the ARP, providing benefits through September 6, 2021. However, the ARP only gives states the option to extend unemployment benefits, since the power to give out unemployment benefits rests with individual states.
The ARP also provides pandemic relief for state and local governments through “$219.8 billion, available through December 31, 2024, for states, territories, and tribal governments to mitigate the financial consequences of COVID-19.” This funding is directed to be used as pandemic relief, such as assistance for households, small businesses, nonprofits, or commercial industries; increasing employee wages or providing grants to employers; aiding to resolve the reduction in state revenue, territories or tribal governments; and investing in infrastructure.
The bill also provides relief via tax cut: for people who claim the extended unemployment benefits, up to $10,200 will be waived from their federal taxes. This component of the law will have the largest effect on the deficit according to the Congressional Budget Office.
Critiques of the ARP
Many argued the ARP was unnecessary considering unemployment rates showed a decreasing trend months before the ARP was passed (seen in Figure 1 and Figure 2). National and state unemployment rates were increased by the consequences of COVID-19. However, these trends shifted after the first stimulus packages from the CARES Act came into effect, causing a steady decrease in national and state unemployment rates through late 2020 and into 2021. The ARP was passed in March of 2021 while unemployment rates were decreasing throughout the United States. This led some economists and politicians to consider the plan excessive or unnecessary, as the ARP includes not only stimulus covering the repercussions of the health crisis, but also a multitude of unemployment programs.
Source: Congressional Research Service
The above graph displays the United States’ national unemployment rate between 2005 and 2021. After hitting a peak of 14.8% in April of 2020, the unemployment rate began a steady decline, reaching 5.8% in May of 2021.
Disputes over the unemployment provisions of the American Rescue Plan remain contentious and are largely fueled by a fundamental disagreement over the role of government in economic policy. One side advocates for laissez-faire capitalism—a system in which the government stays out of the economy and allows individuals to independently make economic decisions. The other is in favor of a more Keynesian approach. Keynesian economics theorizes that increased government spending and lower taxes are necessary during economic downturns in order to stimulate the economy. Those who support Laissez-faire economics believe that government intervention in free markets creates market distortions in the long run, in this case potentially discouraging those receiving benefits from actively seeking new employment. There are further concerns that these temporary provisions may remain in place even after the economy recovers, resulting in a soaring deficit. On the other hand, believers in Keynesian economics argue that the government has a responsibility to provide bailouts and other forms of support to citizens during recessions. Proponents of this view point out that shutdowns in the interest of public health caused unemployment to soar and argue that the unemployment compensation will bolster the economy.
The debate over this provision boils down to a debate over liberty versus equity, with advocates for liberty arguing in favor of lower taxes and minimal social safety nets, while advocates for equity argue that greater public welfare is more important than lower taxes. Equity proponents point to studies that estimate the expansion of the child tax credit could reduce child poverty in the US by 45%, lifting millions of children out of poverty. Conversely, liberty proponents say that money belongs to those who earn it, that private individuals use capital more efficiently than the government, and that high taxes discourage investment.
The ARP also designates nearly $350 billion for states’ budgets, which cannot run deficits in the same manner as the national government. $220 billion of those funds are for states to balance their budgets, which have suffered as a result of the COVID-19 recession, according to the Biden administration. The rest of the funds are specifically designated for states in dealing with the COVID-19 pandemic and its economic focus on reopening in-person primary education. The two categories of education relief are funds to address learning loss due to online schooling and virus mitigation efforts in school, particularly improving ventilation.
Once again, disagreements here can be understood as an argument between Laissez-faire capitalism and Keynesian economics. Critics of this provision point out that many states—including California, New Jersey, Texas, and Arizona—ended the fiscal year with surpluses, arguing that this aid is misdirected and that unconditional bailouts for pension funds represent a moral hazard, a fundamentally Laissez-faire argument. Proponents of Keynesian economics largely support the federal aid for state governments, arguing that it is about more than just replacing tax revenue lost during the pandemic, and more importantly represents an attempt at boosting economic growth because state governments typically invest large portions of their budgets into economic drivers like education and infrastructure.
Much of the debate surrounding the remaining provisions of the bill is centered on whether or not this bill was truly a coronavirus relief bill, as the Treasury Department claims. Some say that because only 9% of the American Rescue Plan’s funds are for direct COVID-19 relief, the bill is too broad and more closely resembles broad economic stimulus. Whether the bill is understood as coronavirus relief or broad economic stimulus, disagreements over the inclusion of the remaining provisions are again centered around a fundamental disagreement over whether governments should practice Laissez-faire capitalism or Keynesian economics, with Laissez-faire capitalism advocates arguing that the bill represents the government exceeding their ideally minimal role in regulating the economy. On the other hand, Keynesian economics supporters say that these stopgap measures are necessary to help millions of people who are struggling through no fault of their own.
Reflection Questions
- Is the American Rescue Plan a COVID-19 relief bill or broad economic stimulus?
- Are you more in favor of Laissez-faire capitalism or Keynesian economics?
- What parts of the ARP would you prefer the federal government renew or make permanent?
- What do the details about the funding mechanisms reveal about federalism and its constraints on national policy making?
- Where in your daily life do you observe the ARP’s footprint?
-
Signs of An Overheating Economy
Healthy, growing economies experience low, steady economic growth. Both producers and consumers benefit during such periods. Issues arise when economic growth is fast for a prolonged period. This type of growth is generally not sustainable; as an economy reaches its capacity to meet the demands from individuals, firms, and the government, a harmful economic downturn is likely to occur.
Economists look at several different indicators to determine whether the economy is stable, including indicators relating to GDP, inflation, unemployment, and borrowing levels.
- Inflation: The economy is overheating when there is a large and prolonged increase in inflation. With this in mind, economists monitor core inflation, or inflation measured on a select basket of goods relating to personal consumption that excludes goods with particularly volatile prices. The Federal Reserve holds a goal for inflation of about 2% and considers core inflation above 3% over a 12-month period to be cause for concern.
- GDP: Economists are primarily concerned with the level of actual GDP compared to potential GDP. Actual GDP or current GDP is the value of all final goods and services produced within an economy in a certain time period. Potential GDP refers to the maximum GDP an economy can sustainably produce given all the available resources. When actual GDP exceeds potential GDP, this is a sign that the economy may be overheating.
- Unemployment: Economists monitor the relationship between the natural rate of unemployment and the actual unemployment rate. The natural rate of unemployment refers to the minimum rate of unemployment a healthy economy can sustain without causing inflation. The actual unemployment rate dropping below the natural rate of unemployment can be a sign of an overheating economy; it can result in wage-driven inflation as empowered workers demand wage increases the economy cannot sustain.
- Market Behavior: During periods of rapid growth, individuals can become over-optimistic about their future income prospects. Sharp increases in borrowing, often caused by low interest rates, is typically a cause for concern. Unrestricted borrowing creates asset bubbles, as well as an overconfidence amongst businesses and households, prompting further investment and consumption above sustainable levels, a phenomenon known as overspeculation. Once the economy ultimately downturns, the resulting wage reductions, job losses, bankruptcies, and cuts to public service are painful.
Historical Example: The Great Depression
In the years preceding the Great Depression, several of the indicators mentioned above can be identified. During the 1920s the economy was booming with an annual GDP growth rate of 4.7% and unemployment averaging just 3.7%, resulting in extreme overconfidence by individuals as well as businesses. The overconfidence spurred increases in investment by individuals and financial institutions, resulting in overspeculation. The stock market exploded due to brokers allowing customers to buy stocks on margin, resulting in asset bubbles that burst in 1929. Additionally, the rate of unemployment in the years preceding the Great Depression (3.7%) was below the natural rate of unemployment, which the Federal Reserve Bank of San Francisco recently determined hovered between 4.5 and 5.5% over the last one hundred years.
In response to these concerning signs, the Federal Reserve engaged in extensive open market sales and hiked the discount rate in 1928-29 in an attempt to discourage speculation. After failing to control speculation, the market crashed and in the following years the Fed raised the discount rate but did not engage in extensive open market operations. It is largely believed that this disastrous policy response worsened the resulting depression. In the years following the crisis, the Fed also increased reserve requirements by 50% to impede over speculation by financial institutions.
Historical Example: The Global Financial Crisis
The 2007-09 crisis was triggered by the housing boom and mortgage mania, but its underlying cause was a vulnerable financial system. The housing bubble burst exposed the lack of regulation of the financial system, which created cascading consequences for the financial sector and the real economy.
Because the United States had not experienced a major financial crisis in decades, people grew comfortable in the seemingly stable system. There were no institutions specifically protecting the system against systemic risk; there was a lack of regulation on shadow banks, incoherent oversight of commercial banks, and spotty regulation of risk-taking.
The housing bubble emerged as overspeculation overtook the markets. In the early and mid-2000s, high-risk mortgages became increasingly available to potential home-buyers. Home prices rapidly rose through this expansion in mortgage credit, which further contributed to the number of high-risk families obtaining loans. Starting in 2000, house prices outpaced the growth of household income. Yet, homeownership reached around 65% during that period. Almost no one recognized that the health of the entire system rested on the perceived health of the mortgage market. Once people’s trust in the housing sector shifted to confusion and fear, mortgages quickly spread panic throughout the system. From their peak in mid-2006 to mid-2009, home prices fell about 30%. Real GDP fell 4.3% from its peak in 2007 to its trough in 2009.
Once the housing bubble burst, the Federal Reserve quickly flooded the system with liquidity. The Fed introduced a series of interventions such as the extension of liquidity to nonbanks, the Term Auction Facility (TAF), and the establishment of swap lines with the ECB and other foreign central banks.
Shortly after, Congress passed the Troubled Asset Relief Program (TARP), which provided $475 billion to restart credit markets, help struggling families avoid foreclosure, as well as stabilize banking institutions, the U.S. auto industry, and A.I.G. Once the private sector regained its confidence to invest in banks, policy makers could work to restart the economy through steps such as quantitative easing, the Recovery Act, the Home Affordable Refinance Program (HARP), and the Home Affordable Modification Program (HAMP).
Looking Forward
So, why does this matter now? As the federal government has unveiled various stimulus packages in response to the COVID-19 pandemic, economists have debated whether or not the large influx in the money supply could overheat the economy. Some experts worry that labor shortages and rising prices point to a long-term period of inflation. Others argue that the recovery plan meets the scale of the economic crisis and that prices will recalibrate, stabilizing inflation. Some even say that an overheating economy is not necessarily a bad thing, arguing that resulting worker benefits—such as low unemployment, upward wage pressures, and diminished discrimination—are hallmarks of a strong economy. However, most acknowledge that an economy that undergoes a period of sustained overheating is problematic as rampant inflation would cause the Fed to hike interest rates, ultimately sending the economy into a recession.
Of the indicators discussed above, core inflation is currently the prime concern, with CPI rising 5.4% this June over last June, the largest 12-month increase since the 12-month period ending in August 2008. However, Federal Reserve chairman Jerome Powell sustains that supply chain challenges are partly responsible for the increase in CPI and those effects will be reversed when the bottlenecks unwind. Current projections from the Congressional Budget Office also show that real GDP is expected to surpass potential GDP in 2025 and remain above potential GDP through 2028.
-
The Effect of Monetary Policies on the Unemployment Rate
Monetary policy refers to the actions that a nation’s central bank engages in to influence the amount of money and credit in its economy. Such policies directly affect the interest rate, which indirectly affects spending, investment, production, employment, and inflation. Ideally, central banks are an independent government entity. While their operations are accountable to citizens and the government, other branches of government cannot directly control the central bank.
In the United States, the central bank is the Federal Reserve. Monetary policy consists of the Federal Reserve’s strategies to promote price stability, moderate long-term interest rates, and maximum employment. The Fed works towards these goals through three primary instruments: open market operations, the discount rate, and reserve requirements. The Federal Open Market Committee (FOMC) is the Fed’s main monetary policymaking body.
Contractionary and expansionary monetary policy are the two primary avenues of monetary policy. Contractionary monetary policy decreases the supply of money while expansionary monetary policy increases the supply of money in an economy. When GDP is high and the inflation rate is climbing, the Fed engages in contractionary monetary policy. Conversely, during periods of low GDP and high unemployment, the Fed utilizes expansionary monetary policy.
During periods of high unemployment, individuals’ disposable income declines from a lack of stable income. This causes the demand for goods and services to decline. Businesses tend to suffer from this decline in consumption, which is often accompanied by a drop in GDP. The Federal Reserve responds to rising unemployment by boosting aggregate demand, the sum of spending by households, businesses, and the government in an economy. Heightening the demand for goods and services— expanding the economy— increases production of such goods and services; businesses then begin to employ additional workers to meet the supply of goods demanded by consumers.
The Federal Reserve increases aggregate demand through the federal funds rate. Set by the Fed, the federal funds rate is “the rate that banks pay for overnight borrowing in the federal funds market.” Changes to the federal funds rate triggers changes to other interest rates in the economy. Thus, the Fed can indirectly decrease interest rates. Households and businesses are encouraged to borrow and spend, which promotes overall economic activity and growth. Specifically, the economic position of businesses improves, affording them the opportunity to hire additional workers.
For example, in 2020 the unemployment rate more than tripled and GDP sharply declined. The U.S. economy depressed, entering a period of recession in the business cycle. Accordingly, the federal funds rate greatly declined in 2020 to increase the money supply and encourage household investment and spending. A similar phenomenon occurred during the recession of 2007-2009. The federal funds rate dips as the unemployment rate increases. Conversely, the federal funds rate remains relatively constant and increases only slightly when unemployment rates are declining.
While the Fed aims to reduce unemployment by increasing the demand for goods and services, a growth in aggregate demand also causes wages and the cost of goods and services to increase. This increase in the price level results in inflation. Thus, there exists a short-run tradeoff between reducing unemployment and experiencing inflation. This tradeoff is called the Phillips curve.
The inflation rate is determined by three factors: cyclical unemployment (the deviation of unemployment from the natural rate), expected inflation, and supply shocks. The addition of the latter two factors to the curve occurred following the stagflation of the 1970s. The oil crisis of 1973 highlighted the effect of supply shocks and stagflation on the long-run aggregate supply curve. Experts also realized that once inflation is already occurring, the tradeoff between unemployment and inflation disappears.
This process can be seen during Fed Chairman Paul Volcker’s disinflation throughout the 1980s. In early 1980, inflation reached a peak of 11%. The Fed brought down the inflation rate to 4% by the end of 1983. Engineering this reduction in inflation required a loss of twenty percentage points of GDP; the U.S. experienced two recessions, one of which was the largest cumulative business cycle decline of employment and output in the post-World War II period. Disinflation is often not painless. However, the costliness of new policies to reduce inflation are often influenced by their credibility. Forecasting the results of new policies requires predicting how the public will view such policies, which is often difficult.
Most economists believe that the Phillips curve operates in the short run: fluctuations in aggregate demand only affect unemployment and output in the short run. Over the long-run, unemployment returns to its natural level. However, some experts argue that changing the real interest rate influences not only the actual unemployment rate but also the natural rate of unemployment. The Phillips curve represents a traditional understanding of unemployment and inflation. It continues to guide the Fed’s forecasts and policy decisions. In recent decades, the relationship between the two variables has weakened, flattening the curve. Experts have expressed concerns about the reliability of the curve as an effective tool to direct monetary policy.
Engaging in expansionary monetary policy for an extended period of time may allow for greater systemic risk in the system, leading to the emergence of an asset bubble. Asset bubbles occur when assets increase over a short period of time, unsupported by the value of the asset. During these periods of instability, some Fed’s decisions may increase economic vulnerability. Such was the case in the 2000s, when the Fed cut interest rates to historically low levels during the recession of 2001. While low interest rates helped the economy recover, they also played a role in easing the process of getting a mortgage and buying a home. Housing demand and home prices drove up, creating the housing bubble which ultimately burst.
Critics claim there needs to be stronger regulatory responses by the Fed to combat instability caused by monetary policy decisions. However, the effectiveness of monetary decisions on economic stability are hindered by the presence of lags on policy. Implementation lags are short term, influenced by the open-market operations required by policy changes to be put into immediate effect. Impact lags are more long term and are influenced by multiple factors, such as the deposit expansion process delaying, firms and businesses needing time to adjust to interest rates, and delaying effects of changes to exchange rates and net exports.
Another long-term concern of expansionary monetary policy is that countries are increasingly susceptible to falling into the liquidity trap. This trap occurs when low interest rates align with low investment spending. To combat the possibility of a liquidity trap, the Fed utilizes expansionary monetary policies.
Other economists believe that central banks can further expand the economy when the interest rate hits the lower bound of zero. Lowering longer-term interest rates, for example, through forward guidance and quantitative easing can stimulate the economy.
Some experts argue that monetary policy affects not only the actual rate of unemployment but also the natural rate of unemployment. A clear instance of this phenomenon can be seen during recessions, which may also leave permanent scars on the economy. For example, the job search may become permanently inhibited as skills or motivation to find employment diminishes; thus, the amount of frictional unemployment increases. Moreover, real wages may be pushed above equilibrium level, leading to an increase in the amount of structural unemployment.
Reflection Questions:
- Do you agree or disagree with critics that there needs to be stronger regulatory responses by the Federal Reserve to combat instability caused by monetary policy decisions?
- Would you say the Phillips Curve is a reliable tool to direct monetary policy?
- Are you in favor of lowering longer-term interest rates, such as through quantitative easing, to stimulate the economy?
- How would you like to see changes in monetary policy of the Federal Reserve, specifically for an indirect effect on unemployment rate?
-

The Poverty Line in the U.S
The poverty line, or poverty threshold, is the minimum amount of income that a family needs for food, clothing, transportation, shelter, and other necessities, once a year. It represents the border between poverty and non-poverty for administrative and statistical purposes. In many countries, such as the United States, this statistic is adjusted yearly for inflation. An example of the U.S. poverty line in the year 2021 is shown below. The poverty line varies according to the number of persons in a household.
Source: Department of Health and Human Services
There are two versions of the poverty line in the United States:
- The poverty thresholds are the original version of the federal poverty measure. They are updated each year by the Census Bureau. The thresholds are used mainly for statistical purposes. For instance, preparing estimates of the number of Americans in poverty each year.
- The poverty guidelines are the other version of the federal poverty measure. They are issued each year in the Federal Register by the Department of Health and Human Services (HHS). The guidelines are a simplification of the poverty thresholds for use for administrative purposes. For instance, determining financial eligibility for certain federal programs such as Project Head Start.
Methods of Evaluating Poverty
One of the methods to calculate the poverty line in the U.S. is the Gallup Poll. The national survey has regularly asked people to report what is the least amount of income a family needs in order to get along in their community. However, it is possible that some interest groups may ask people to inflate their answers with the expectation of higher benefits.
The other popular method to evaluate poverty is through counting calories. The relationship between hunger and poverty remains strong, and many countries calculate poverty lines by calculating how much it costs to obtain enough food. Such calculation meets a calorie norm of around 2,000 calories a day, which is recommended by nutritional experts at the Food and Agricultural Organization of the United Nations.
Calories can be converted into money by looking at what people spend and finding the income level at which, on average, people get 2,000 calories. This can be done by plotting what is called the “calorie Engel curve.” For example, in the United States, the poverty line was set by starting not from a calorie norm but from an economic food plan recommended by the Department of Agriculture.
Poverty Classification
- Relative poverty is identified as the inability to participate in society. Relative measures of poverty are often constructed by using poverty lines that move with average income, so that the minimum acceptable income is tied to what other people get. To some people, poverty also means lack of access to education, healthcare, or even entertainment. Relative poverty is a much more complicated concept. This concept of relative poverty is often used in developed worlds.
- Absolute poverty is simply not having enough to eat or enjoy good health, a severe lack of access to basic human needs. The basic living standards are consistent over time and globally, for example all humans need the same caloric and water intake no matter where they live.
The 2001 poverty line in the United States for a family of two adults and two children was $18,000 a year, more than ten times as much as the international “extreme poverty” line of $1 per person per day used by the World Bank and the United Nations.
The poverty line is used today to decide whether the income level of an individual or family qualifies them for certain federal benefits and programs. There are numerous United States policies regarding the poverty line, such as the recently passed American Rescue Plan by the Biden Administration. President Biden’s healthcare proposal aims to expand the Affordable Care Act so that 97% of Americans are insured, and will cost $750 billion over 10 years. It would include a public health insurance option like Medicare, which will be available premium-free to individuals in states that haven’t expanded Medicaid and to people making below 138% of the federal poverty level. It would also eliminate the 400% federal poverty level income cap for tax credit eligibility and lower employees’ maximum contribution for coverage to 8.5%. Many federal programs, such as the National School Lunch Program, are created and adjusted based on the poverty line. These programs are made as an effort to make food more accessible for those below the poverty line guidelines each year. The National School Lunch Program was created initially in 1946, with about 7.1 billion children participating that year. The program has grown dramatically, with 30.4 million children participating in 2016. Depending on family income, students can receive reduced or free meals.
Some critics argue that measuring poverty in the United States based solely on the cost of food ignores other significant factors that may influence a household or individual’s wealth. For instance, there are a multitude of factors, such as health conditions or access to transportation, that could impact how much someone could earn or how much they must spend. If an individual has a medical condition which their insurance does not cover, their spending will be higher than an individual without such a condition, even if they have the same incomes and spending habits.
-
Local Governance Project: Charlottesville
Fig 3: Climate Action Plan
FOCUS: WATER AND ENERGY USE
- Startup page provides information on how to use the online tool and its purpose
- FAQ page available in case residents have questions on usage and how their data is used
- Press ‘Explore’ to begin the online questionnaire
- Always available help button in bottom right corner
- Progress shown on left side of page
Written by: Luke Aminuddin
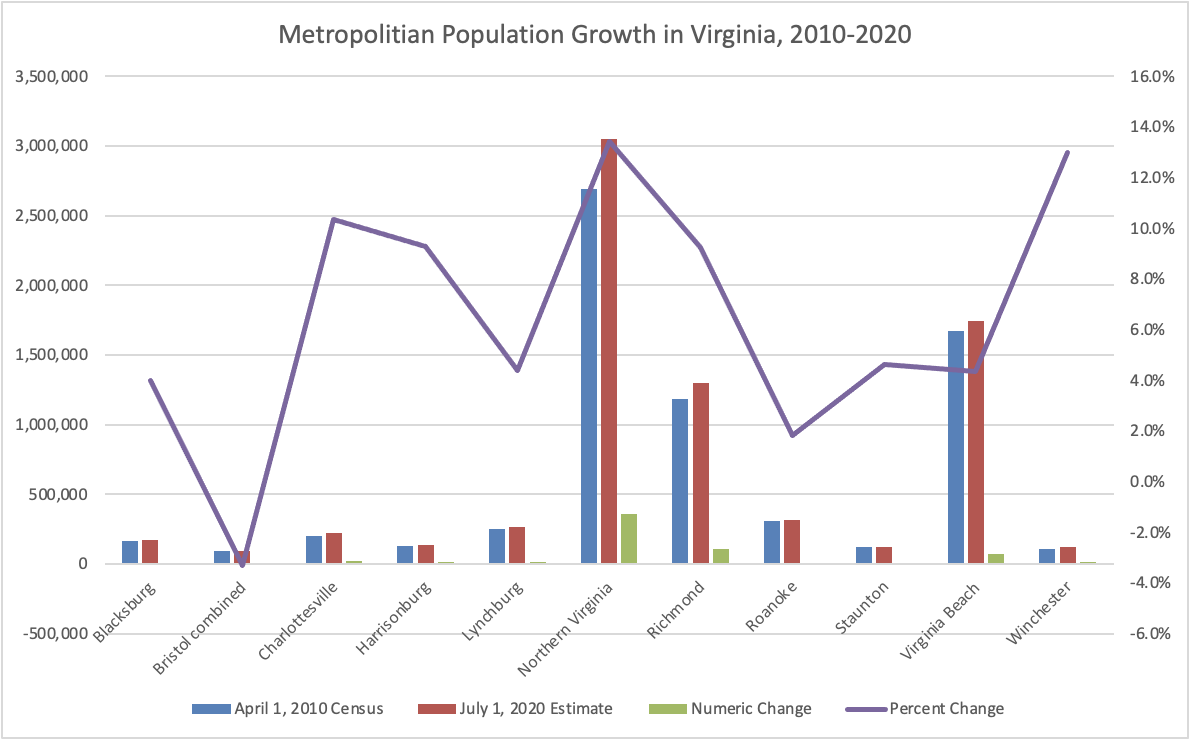
Fig. 1: Percent population growth in metropolitan of Virginia between 2010-2020
A 2020 population study by the Weldon Cooper Center at the University of Virginia identified the city of Charlottesville as the third-largest-growing metropolitan area in Virginia; it experienced a 10.4% population increase between the 2010 Census and the 2020 Census estimate (see fig. 1).
Charlottesville is developing as a central hub for economic and social opportunities. But this also presents new challenges as more people settle in the city and new developments sprout up. Specifically, the urbanization of Charlottesville over the last decade has raised concerns about environmental health and the need for more sustainable practices. During the last two decades, Charlottesville has made important strides to make the city ‘green’ and adopt more sustainable practices. One important sustainable measure that Charlottesville has prioritized is green infrastructure, a term that originated in 1995 publication with initial practical applications in Florida. Green infrastructure is an ecological perspective that stresses the connectivity and multi-functionality of green spaces with “infrastructure” including both natural and nature-mimicking structures. Some examples of green infrastructure are urban tree canopy coverage and green roofs with benefits including the improvement of water and air quality and the mitigation of the urban heat island effect. While green infrastructure projects can be found around the world, the high costs for installation and maintenance have so far limited their proliferation.
Charlottesville offers a green roof building permit fee reduction and has established an initiative to be a “Green City” by 2025. However, there is much more the city of Charlottesville can do to achieve its goal of being a “Green City.” After further outlining green infrastructure, its benefits, and describing past actions on the state and local levels, this policy solution will introduce new incentive measures to further encourage the use of green infrastructure and will provide target areas of need in Charlottesville.
Green Infrastructure Defined: the Benefits and Drawbacks
According to the EPA, green infrastructure (GI) is a “cost-effective, resilient approach to managing wet weather impacts that provides many community benefits.” Furthermore, Section 502 of the Clean Water Act describes green infrastructure as the “the range of measures that use plant or soil systems, permeable pavement or other permeable surfaces or substrates, stormwater harvest and reuse, or landscaping to store, infiltrate, or evapotranspirate stormwater and reduce flows to sewer systems or to surface waters.
GI can be categorized in two main forms. Natural green infrastructure includes trees, shrubs, grass, and soils. Green stormwater infrastructures are engineered systems that mimic natural processes to treat stormwater and also provide habitats, especially as part of the physical infrastructure of a building. A green roof is “a layer of vegetation planted over a waterproofing system that is installed on top of a flat or slightly–sloped roof.” Green roofs are categorized as extensive (lightweight, thin soil, and little-to-no irrigation) or intensive (deep soil, irrigated, and better for plants). Green walls include green façades, where climbing or hanging plants reside on a wall, or living walls, where vegetation is integrated through a wall cladding technique. Living walls are better suited for tall buildings.
Fig. 2: A living wall system featured at the Caixa Forum in Madrid, Spain
GI can positively impact the environment, as well as provide social and economic benefits. Most notably, GI systems help manage stormwater by retaining and filtering rainwater, which can reduce runoff by 54-62%. In detail, a UK study conducted by the University of Sheffield and the University of Leeds showed noticeable and quantifiable differences between roofs constructed of vegatitative material and ones made of non-vegetative material. Specifically, for most wet weather events, the vegetative roofs detained up to 60% of runoff compared to 40% for unvegetated roofs. Also, vegetative roofs during large rainfall events retained 5-10mm more water than unvegetated roofs. Furthermore, research conducted in Charlottesville by the Green Infrastructure Center, Inc. (GIC) showed similar results. In more urban parts of the city, high runoff has continuously introduced harmful pollutants to the Rivanna River, an important tributary of the James River. The main solution to this problem is maintaining and increasing the urban tree canopy coverage, which can reduce runoff anywhere between 2-7% (see page 8 of the City GreenPrint 1.0).
In some cases, these vegetative infrastructure solutions provide habitats to wildlife. University of Southampton research revealed that green walls have proven benefits for biodiversity by providing a habitat for invertebrates and nesting, food, and sheltering for local birds. Moreover, green walls can support biodiversity in cities by acting as a “corridor” to facilitate movement for local species. Urban noise reduction is also a significant benefit of green infrastructure systems as green roofs can provide pronounced sound absorption by muffling noise vibrations between 250 Hz and 2000 Hz. Meanwhile, another benefit provided by green roofs is the mitigation of the urban heat island effect. A Columbia University study comparing green roofs with highly-reflective white roofs and traditional black roofs showed that green roofs performed better at retaining heat and reducing heat dissipation. In the winter, thermal oscillations reached a peak of 10 °C for green roofs compared to peaks of 40 °C and 30 °C for black roofs and white roofs, respectively. Similarly, in the summer, green roofs reduce heat dissipation and guarantee low temperatures with thermal oscillations of less than 20 °C. Although white roofs performed similarly to green roofs in the summer with thermal oscillations of about 30 °C, the daily thermal oscillation for black roofs was recorded around 60 °C. The heat retaining technology and reduced heat dissipation rates in green infrastructure also play a role in reducing energy usage for buildings. Green walls can reduce energy usage by 58.9% and 33.8% energy savings for green façades.
Another positive development of green infrastructure is the improvement of air quality in surrounding urban areas. Especially in regards to green walls, GI can improve air quality by increasing air flow rate, which facilitates improved bio-filtration. Specifically, green walls and other GI systems aid in reducing the releasing of volatile organic compounds, inorganic gaseous compounds, and carbon dioxide from buildings. Finally, beyond environmental benefits, there are social and economic benefits of GI as well. Namely, this includes the increase of the economic and aesthetic value of buildings and public spaces. Green infrastructure improvements can provide an escape from the urban jungle while creating opportunities for community cohesion and improvements to health and well-being through the planting of vegetables and fruit trees.
Many public and private investors are hesitant to install or maintain GI systems. The main hindrance is the high costs involved with installation and maintenance. Depending on the typology, a green roof can cost anywhere between 60-600 $/m2. Meanwhile, green façades can cost 12-940 $/m2 and 350-3290 $/m2 for living walls. Hence, many investors are discouraged because the perceived environmental, social, and economic benefits are outweighed by the high short term implementation costs. In order to encourage the use of green infrastructure, governments around the world have developed incentive policies like financial subsidies, tax and interest rate reductions, reduced cost and timeframe to obtain construction permits, sustainability certifications, and obligations by law.
Past Actions on the State and Local Levels
Virginia passed 9VAC25-890-40 to provide permits for towns, cities, universities, and other institutional organizations like the military and federal facilities in order to collect stormwater and ensure improved water quality. VA code § 58.1-3852 defines green roofs and provides counties, cities, and other localities with discretion to grant incentives or provide regulatory flexibility for green roof installations.
Charlottesville has established its own green roof building permit fee reduction. This incentive policy applies to commercial/non-residential and residential properties and allows for up to a 50% reduction to the building permit fee if a green roof is constructed. According to Home Advisor, the average national cost for building permit fees is about $1,330 and can run as high as $7,500 in some cities, so a 50% reduction is very sufficient. Moreover, Charlottesville has also established ambitious initiatives and plans to make the city more environmentally sustainable. The Strategic Plan outlines five goals to make Charlottesville, one of which promises to create “A Beautiful and Sustainable Natural and Built Environment.” Additionally, the Charlottesville City Council created a vision statement that promises to make Charlottesville a “Green City” by 2025.
An important contributor to increased sustainability and the encouragement of green infrastructure in Charlottesville is the Green Infrastructure Center, Inc. (GIC). GIC has expanded GI systems in Charlottesville by mapping urban tree canopies, creating and protecting habitat patches, which provides benefits for ecosystems and wind protection for buildings, maintaining current parks and trails and enhancing micro habitats. But the most important benefit, according to GIC, of establishing green infrastructure in Charlottesville is stormwater management.
Policy Solution: New Incentive Policies and Target Areas
Property tax reduction: Brazil implemented a property tax reduction to incentivize households to adopt green infrastructure. In the “IPTU Verde” program in Salvador, when a green roof is installed, property taxes are reduced by 5-10% for a 3-year period which can be extended. Closer to home, New York City also has a property tax reduction incentive policy to promote green roofs. In this case, an owner can receive a one-year tax abatement, which entails tax relief of $4.50/ft2 of constructed green roofs with a maximum tax abatement of $100,000.
Mandatory GI regulations: the government could require new commercial, institutional, and residential developments to install green roofs. This is the second most popular policy used to encourage green roofs. The city of Toronto requires green roofs to cover 20-60% of the rooftop area. Meanwhile, despite some backtracking, the state of California became the first U.S. state to require solar roofs for new housing developments.
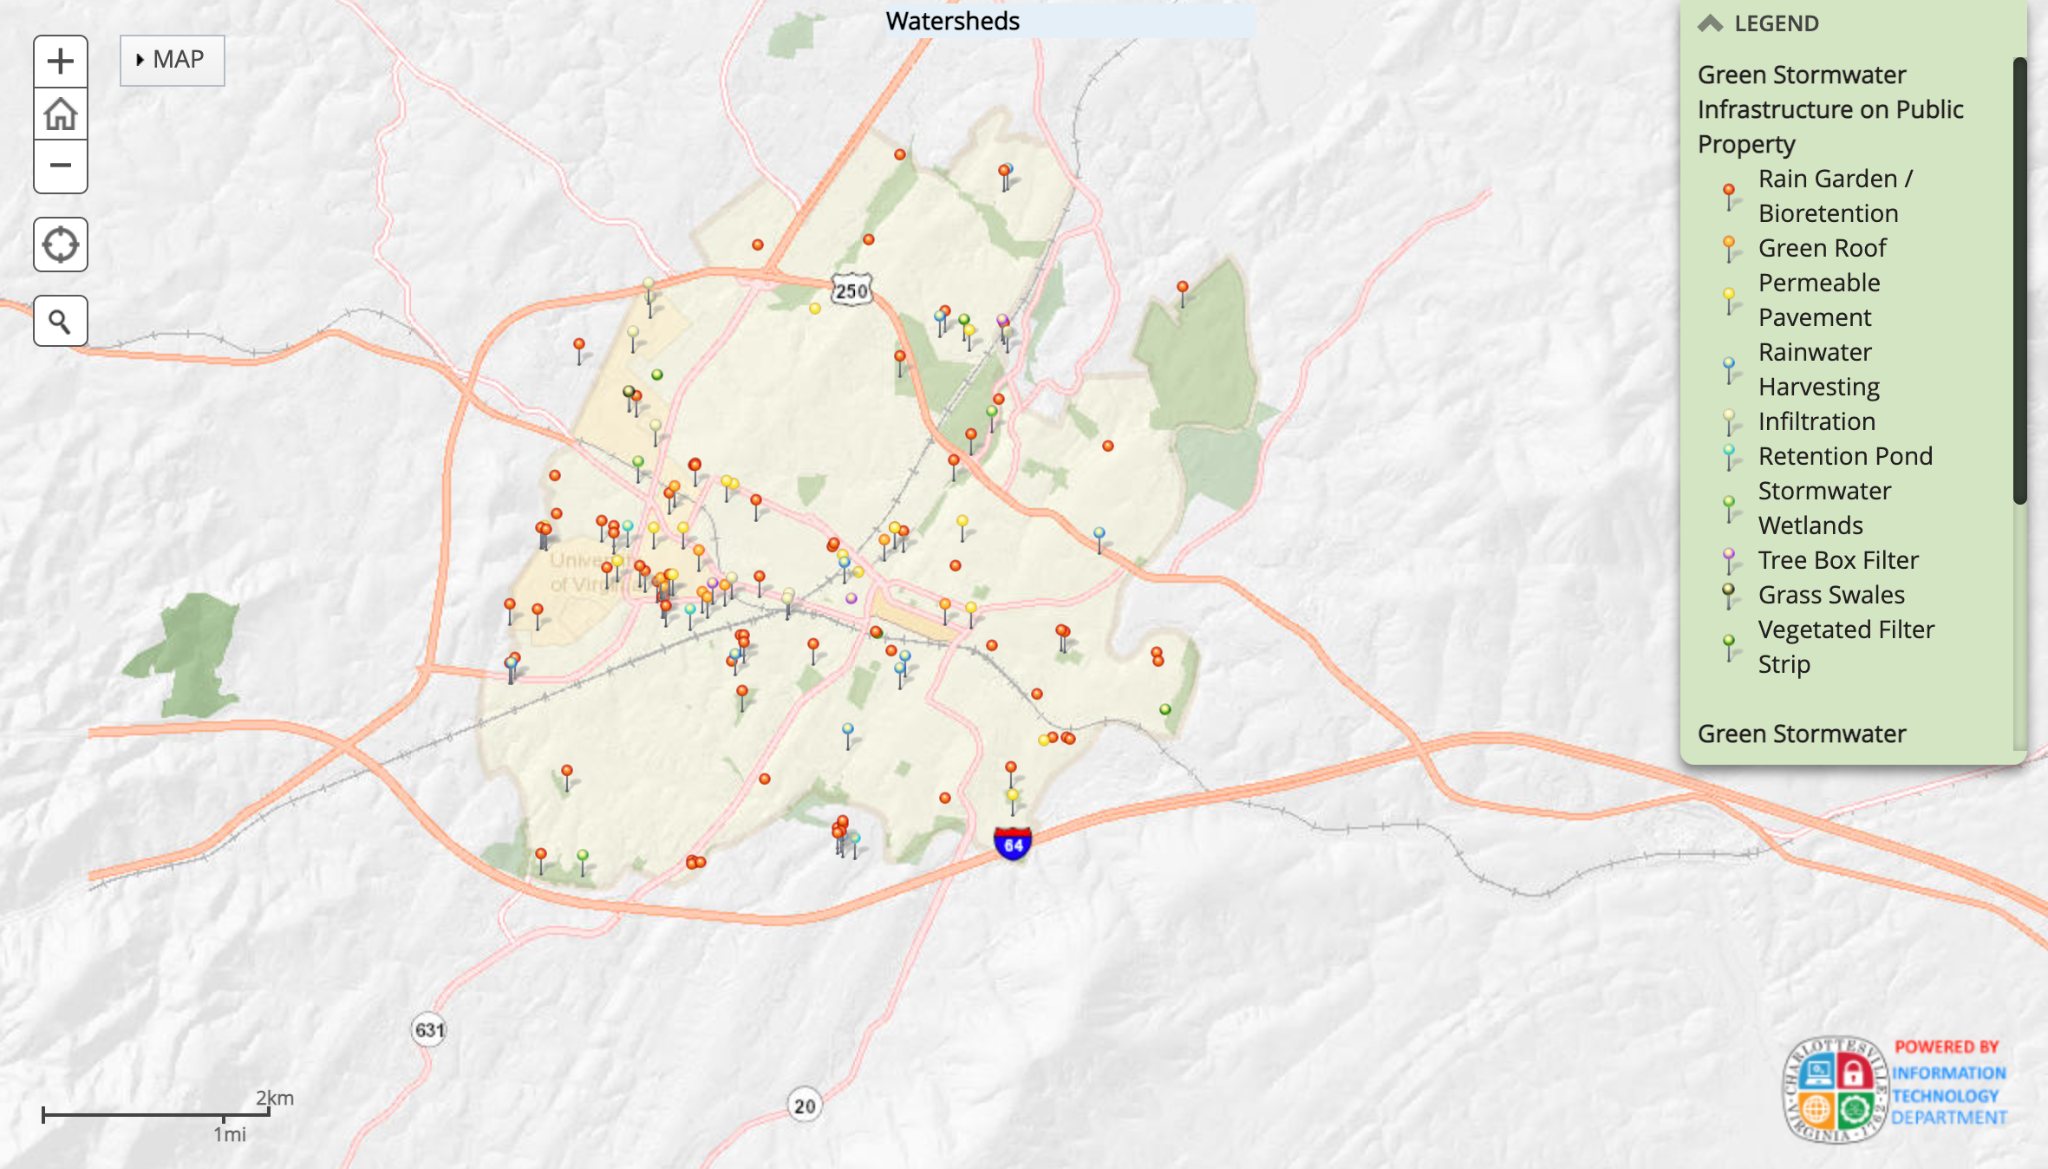
For the city of Charlottesville, it is imperative to consider either or both of these policy types in order to encourage the adoption of new green infrastructure systems. As such, it is recommended that Charlottesville provides a property tax reduction of a minimum of $200 annually and up to $1000 annually for a 2-3 year period for new green roof installations. According to Zillow, the average real estate property price for homes in Charlottesville is about $395,666. Being that the real estate tax for properties in Charlottesville is $0.95 per $100 of value, a minimum of $200 off of property taxes is reasonable. Cases for property tax reductions should be assessed individually based on a number of criteria including the extent of the green roof, the value of the property, and the total price of other expenses involved in green roof installation. Also, it is strongly encouraged that Charlottesville considers adopting and enforcing a green roof mandate for new commercial and residential developments. This policy will be similar to the solar roof mandate established in California. While it is not feasible to expect every building in the city to install green roofs or walls, there are particular neighborhoods that should be considered including Johnson Village, Fry’s Spring, Belmont, Martha Jefferson, Locust Grove, and UVA off-Grounds living near and around Rugby Road. These areas, according to CityGreen maps (see fig. 3), lack green stormwater infrastructure. In order to achieve Charlottesville’s goal of becoming a “Green City” by 2025, these areas should be assessed and considered for new green infrastructure projects.
Fig. 3: Map of current green infrastructure projects in Charlottesville
Comparison and Implementation
All three policy proposals—the Webpage Overhaul, the Information Campaign, and the inclusion of New Incentive Policies to support Green Roofs and Walls—have the potential to mitigate the impacts of climate change in Charlottesville. However, when compared by equity, cost, and effectiveness, the idea for a Webpage Overhaul has the greatest efficacy.
The Webpage Overhaul and the Information Campaign are both equitable solutions for the citizens of Charlottesville. They are an extension of preexisting Climate Action Incentives which already gear some of their benefits toward low-income households in order to supply affordable and energy efficient home appliances (many providing free programs, assessments, and installments to families who meet the income requirements). Many of the programs can be accessed despite a low-income status, and are meant to help those who do not have the means to adapt their homes to be more climate conscious. The New Green Infrastructure Incentives would only be affordable to corporations, willing landlords, and the wealthy. As stated, while green infrastructure like green roofs are effective in dampening a slew of environmental negatives, they are also expensive. Even with the proposed incentives of a property tax reduction and regulations, disadvantaged families would be left behind since those incentives might not be enough to breach the gap of what they’re willing (or able) to pay.
When considering cost to both the government and citizens, the New Incentives for Green Infrastructure is the most expensive. Any new incentives, be it payouts or tax reductions, are lost revenue sources for the government, and any implementation of green infrastructure would be a financial burden to those citizens who take advantage of it. The other two policy proposals are merely rebrandings of preexisting costs and therefore don’t substantially increase government expenses. A Website Overhaul would be more expensive then an Information Campaign given the technical expertise and programming needed for the website, and so technically the Information Campaign is the cheapest of the three.
In terms of immediate effectiveness, the Webpage overhaul beats out even the Information Campaign. While the Campaign might help spread the message, it attempts to make the options more well-known rather than streamline the process of utilizing them. The Webpage Overhaul, on the other hand, takes a potentially confusing process and streamlines it for easy use, resulting in increased utilization of the Climate Action Incentives. However, to be most effective these policies should be used in tandem. The Green Infrastructure could take years to implement, both with the bureaucratic struggle of creating new incentives and the actual implementation of any Green Infrastructure. The benefits of the proposal would also take years to kick in and thus should not be the immediate focus of attention.
While the Webpage Overhaul is low cost, equitable, and effective in the short term, the other two policies should not be dismissed. The Information Campaign should be used together with the Overhaul in order to maximize the usage of the Climate Action Incentives, optimizing those pre-existing policies. At a certain point, the Climate Action Incentives will reach a cap of how effectively they battle emissions, and new policies and ideas will need to be implemented to further combat climate change. This is where an emphasis on Green Infrastructure comes in. The idea has many benefits and should be implemented for the reasons stated in the description of its policy proposal, as it can be more effective in the long term at helping Charlotteville become a green city.
-
Introduction to Environmental Justice
Introduction
Environmental justice is concerned with the unequal distribution of environmental benefits and costs/damages amongst different social groups. “Environmental justice” typically refers to 1) the body of research aimed at identifying and understanding such inequalities, or 2) the social movement seeking to extend equal social participation in decision making processes to ensure all communities are able to have a say on activities that impact their environment. Environmental justice is an intersectional concept, combining notions of social justice with environmental advocacy, and holds that we are unable to care for the planet and combat climate change until we address the human lives that are put at risk from environmental degradation.
Environmental justice only became a mainstream movement in recent years. As a result, generations of impoverished individuals and/or people of color have faced disproportionately large ecological risks, often resulting in property loss, problematic health conditions, and/or death. In recent years, environmental justice has become increasingly relevant as climate change has exacerbated and created new environmental challenges which impact communities across the Country. By bringing these communities to the forefront of conversations about climate change and natural resource extraction and use, advocates hope to create a more inclusive and equitable environmental movement. Though the merits of environmental justice are refuted by some, who tend to dispute the existence of climate change or the ways in which communities of color are disproportionately impacted by policy failings, proponents highlight how discussing past and present instances of environmental injustices are critical in moving towards a more environmentally equitable future.
Factors which led to the Environmental Justice Movement
Issues of environmental injustice within the United States date back to some of the earliest appearances of European settlers. For example, European colonizers removed indigenous peoples from their land and forcibly relocated them onto unfamiliar, relatively unproductive territory. Settlers engaged in strategic buffalo killings, slaughtering them to near-extinction as a way to limit Native Americans’ food supplies, and European Americans consistently silenced indigenous peoples during attempts to speak out against their mistreatment and the mistreatment of the environment. Anti-indigenous sentiments held by the earliest European settlers still carry into the present day, as many Native Americans remain subjected to some of the worst environmental and health conditions in the nation. The 20th century in particular brought unique challenges for various vulnerable peoples. Urban planners placed the majority of waste incinerators in marginalized communities, leaving residents with harmful respiratory illnesses. Uranium mining companies created hundreds of mines on Navajo territory which greatly increased their lung cancer rates. Chemical plants were built in historically black and/or low-income neighborhoods, polluting their drinking water.
Though the environmental justice movement did not emerge as a coherent discourse until the 1980’s, these historical injustices fueled civil rights movements in the 1960’s which emphasised the continuing public health dangers faced by communities of color. In 1968, African Americans organized the Memphis Sanitation Strike to obtain better working conditions for Memphis garbage workers, largely considered one of the first attempts to advance issues of environmental justice within the US. This momentum carried through to 1982, when civil rights activists attempted to stop North Carolina from dumping 120 million pounds of PCB-contaminated soil (a persistent organic pollutant) into a county overwhelmingly occupied by African Americans. While the protest was ultimately unsuccessful, it led to several high profile prosecutions, and is seen to be the catalyst for the Environmental Justice Movement.
Arguments For Environmental Justice
Proponents of the Environmental Justice movement, specifically those directly impacted by environmental degradation and those who understand the urgency for climate action, seek societal and governmental change to rectify historical injustices and prevent the continued harming of marginalized communities. Government intervention is considered necessary because many of the problems occurring from injustices arise from federal and state policy failings or omissions. The growing threat of climate change is expected to disproportionately impact disadvantaged communities further.
- Inequalities in the ability to recover from wildfires worsened by global warming will leave many lower-income individuals homeless.
- The placement of low-income and minority housing in floodplains will cause them to experience higher death tolls under severe sea level rise.
- Disparities in emergency preparedness mean marginalized communities will face disproportionate risks as hurricanes become stronger and more frequent.
Overwhelming capitalist interests, systemic racism, class discrimination, and more, effectively devalue the worth of certain human lives over others and contribute to such environmental injustices.
Advocates argue that without adequate societal, cultural, and political changes, those bearing the brunt of the climate crisis will continue to be the country’s most vulnerable individuals. Marginalized communities already face discrimination and exclusion in various forms, putting them at a severe social, cultural, economic, and political disadvantage. More specifically, because marginalized communities have less time, resources, and political power to resist unequal environmental conditions, improving public awareness and motivation to tackle environmental injustices is an important first step. Not only does the power to address environmental injustices lie with policymakers, wealthy company owners, government agencies, etc., it lies with informed and democratically-engaged citizens. Whether through participating in citizen groups and activist organizations, voting for certain political candidates, or reaching out to elected officials, everyday citizens can create tangible differences in their communities, their states, and beyond.
Arguments Against Environmental Justice
The Environmental Justice Movement faces criticisms from those who believe that increasing government intervention is unnecessary, and simply gives politicians more power to control and harm American citizens. They claim the stricter rules and regulations following environmental justice advancements would inadvertently prevent the creation of jobs and reduce economic output. One example cited by environmental justice critics is the EPA’s 1998 blockage of the construction of a new plastics factory in Convent, Louisiana. What may have brought economic prosperity and 2,000+ jobs to a poor, predominantly African American town was instead halted by supposedly unfounded cancer concerns. Additionally, while many Americans can agree that pollution is an issue, some critics believe that the effects of pollution on the health of marginalized communities are negligible, citing behaviors such as increased smoking rates and drug usage as reasons for reduced minority community health.
Overview of Environmental Justice Policies
Since the 1980’s, local, state, and federally elected officials have attempted to address environmental injustices via legislation and policy changes. On the federal level, the National Environmental Policy Act (NEPA) requires federal agencies to take environmental justice into consideration when engaging in governmental activities. State involvement in tackling environmental justice issues vary widely, with some states establishing strong environmental justice policies, and other states such as Oklahoma and Arkansas having none at all. Among some of the most important state regulations regarding environmental justice are the policies outlined in the Virginia Environmental Justice Act, the goals set forth by the California Environmental Protection Agency, and the protections codified by New Jersey’s 2020 Environmental Justice Legislation. Policies on environmental justice can also differ at the local level, with some cities such as San Francisco choosing to consider the environmental justice implications of land use development in contrast to other areas of California, or Atlanta’s focus on public health implications.
While such policies have had some successes, a number of policies have limited and reversed attempts to address EJ issues. For example, the Trump administration’s first proposed budget diminished the EPA, including funding cuts to environmental justice programs. Scott Pruitt, the EPA Administrator under President Trump, marked a significant change for the Agency because Pruitt was well known as an adversary of the EPA who, as Oklahoma Attorney General, repeatedly sued the EPA in opposition to environmental regulation and openly advanced the energy industry’s agenda. President Trump also issued an executive memorandum directing the Secretary of the Army to take all legal steps consistent to approve permits necessary to complete the Dakota Access Pipeline. At a global scale, the Trump Administration’s rejection of climate science and repudiation of the Paris Agreement represents a conscious refusal to take steps to prevent and protect against climate change impacts.
With a new presidential administration, many policy changes are already being discussed regarding environmental justice. The Biden administration is expected to implement environmental justice across all federal agencies, especially the Environmental Protection Agency (EPA). The new EPA Administrator, Michael Regan, seems inclined to incorporate environmental justice as well. He created an Environmental Justice and Equity Board during his time as Secretary of the North Carolina Department of Environmental Quality (NCDEQ), which made beneficial changes including a community mapping system used to inform agency decisions by considering demographic and health information—and which could serve as a model for EPA decision-making. Additionally, the Biden administration is expected to withdraw the Department of Justice’s current prohibition on Supplemental Environmental Projects (“SEPs”). These are voluntary projects with environmental or public health benefits which were previously used as a component of enforcement settlement actions. Although they were considered to be a valuable tool in the Obama-led Department of Justice, they were nixed by the Trump administration due to administrative cost concerns. To proponents, not only are these a valuable compliance tool, they frequently contain a public accountability component which makes them even more effective and responsive to community needs. SEPs are expected to return as a component of EPA settlements in 2021.
In spite of widespread EJ implications from the Trump Administration’s heavy environmental protection and public health setbacks, state and local movements towards a more equitable future are gaining traction. While the federal response to addressing issues of environmental justice is historically poor, local communities have still had numerous successes. San Diego County’s overwhelming approval of an Environmental and Climate Justice Office, Michigan’s creation of the Office of the Environmental Justice Public Advocate, and the 2021 Massachusetts climate law prioritizing environmental justice are only a few recent examples of strong local efforts to ensure the health and safety of vulnerable residents. Such achievements are a testament to the changing attitudes and growing support towards environmental justice issues.
International Impacts
There is much work to be done before all communities experience equal distributions of environmental benefits and costs, especially on a global level. For example, the continued extraction and use of fossil fuels has astronomical impacts on the natural environment, as oil sand drilling, fracking, arctic drilling, and deep water petroleum sources contaminate fresh water, devastate marine systems, cause seismic activity, and exacerbate global warming. Another example is the implications that arise from fisheries around the world. Because of these fisheries, fish stock is decreasing causing concern of overuse and fish shortages. Small-scale fishing communities are reclaiming their rights for access to and control over aquatic commons. Some examples are the ones by intensive fish farms in Turkey or in Chile, big port projects in India and polluting industries in Ecuador. Climate change is a global problem which requires collaboration with other countries to find effective solutions.
Conclusion
For those interested in becoming involved in environmental justice, educating yourself and others is arguably the most important step, so sharing this page and additional ACE resources with those in your community can contribute towards a more environmentally equitable future. For more information on Environmental Justice issues check out the EPA website, or to find out more about how advocacy groups are getting involved, check out the Environmental Justice Foundation or We Act.